AI Peripheral Blood Smear
AI Peripheral Blood Smear
HematologyAI-generated peripheral blood smear image set spanning the full range of microscopy magnification — from 4× scanning power through 100,000× transmission electron microscopy. Each image is generated at a specific magnification increment with the appropriate microscope, stain, and optical parameters for that level. Designed as a continuous zoom-through training reference for hematology education.
Drag & drop images here to add to this specimen
or click Upload Image aboveRelease to upload
Image Library
12 images
Peripheral blood smear at 4× scanning objective. The entire feathered edge of the Wright-stained smear is visible, transitioning from the thick body to the thin monolayer counting area. Pink-stained red blood cells blanket the field as a uniform wash. Individual cells are not resolvable at this power — the goal is to identify the optimal counting zone.
4× scanning objective, NA 0.1. Used to locate the feathered edge and select the monolayer counting area. Cells appear as a pink wash. Zeiss Primostar 3 — teaching-grade clinical microscope.
OpenAI gpt-image-1
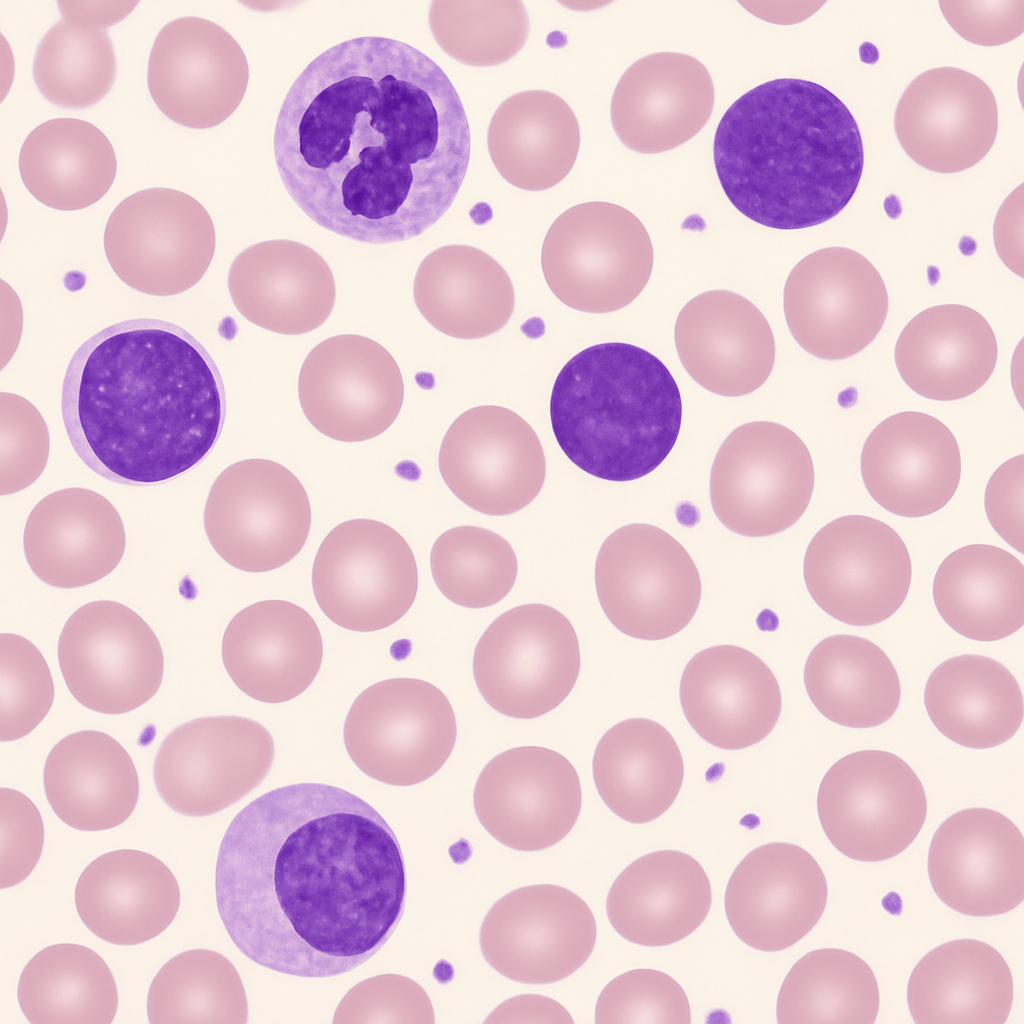
Wright-stained peripheral blood smear at 10× low-power objective. The monolayer region shows evenly distributed red blood cells as small pink dots. Scattered larger dark-purple white blood cells are visible. At this power the overall cellularity, distribution uniformity, and any rouleaux formation or platelet clumps can be assessed.
10× objective, NA 0.25. Assess overall cell distribution, cellularity, and identify areas of interest. WBCs visible as purple spots. Zeiss Axio Imager 2 — research-grade upright microscope.
OpenAI gpt-image-1
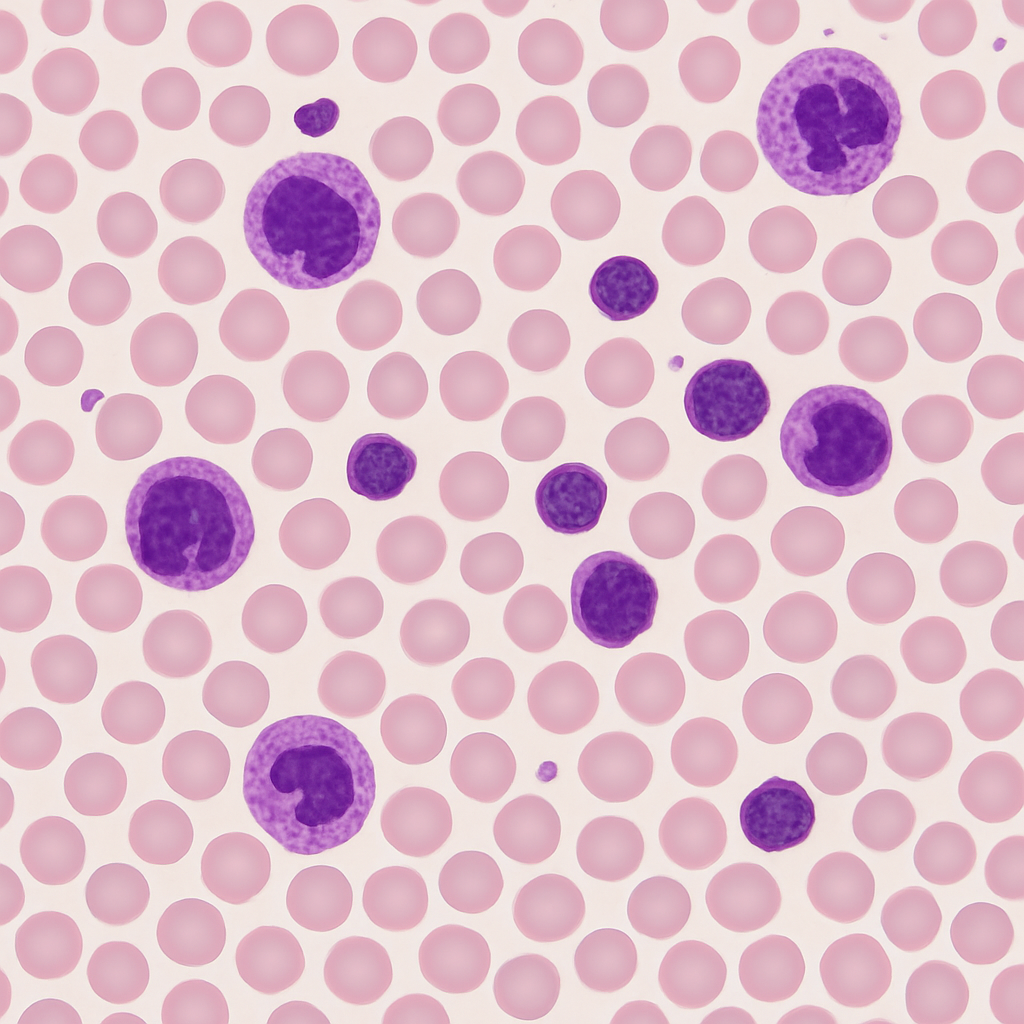
Peripheral blood smear at 20× intermediate objective. Individual red blood cells begin to resolve as small pink biconcave discs with pale centers. White blood cells are clearly distinguishable — their purple nuclei stand out against the pink erythrocyte background. Platelet clusters appear as tiny violet specks between cells. This magnification is used for the initial WBC differential screening pass.
20× objective, NA 0.40. WBC differential screening power — nuclei visible but not detailed. RBCs resolving as individual discs. Olympus BX53 — clinical-grade upright microscope.
OpenAI gpt-image-1
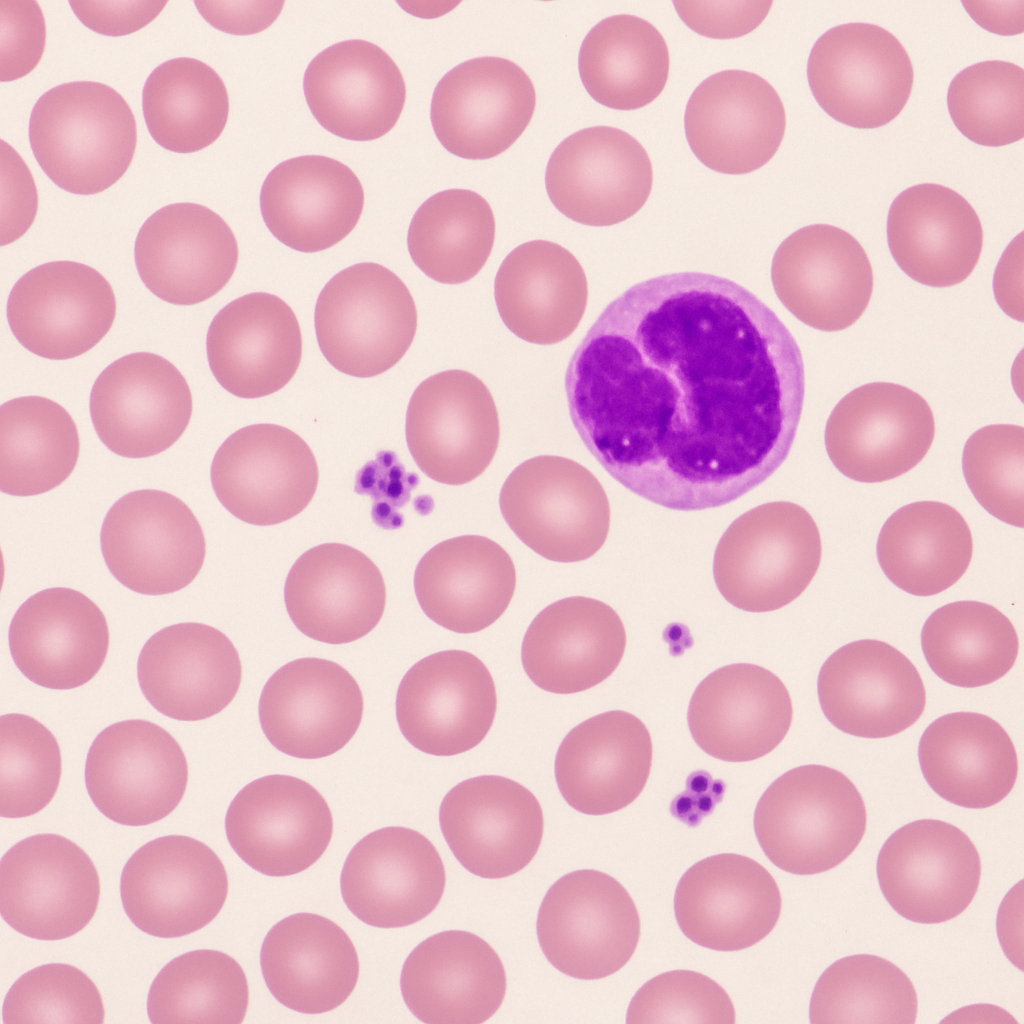
Wright-stained blood smear at 40× high-dry objective. Red blood cells are clearly resolved as 7–8 μm biconcave discs with central pallor. White blood cells show nuclear lobation: segmented neutrophils with 3–5 lobes, lymphocytes with round dense nuclei, monocytes with kidney-shaped nuclei. Platelets are visible as tiny purple granular fragments scattered between cells. This is the standard magnification for performing the 100-cell WBC differential count.
40× high-dry objective, NA 0.65. Standard power for WBC differential count. Nuclear lobation and cell morphology clearly visible. No immersion oil required. Nikon Eclipse Ni — research-grade upright microscope.
OpenAI gpt-image-1
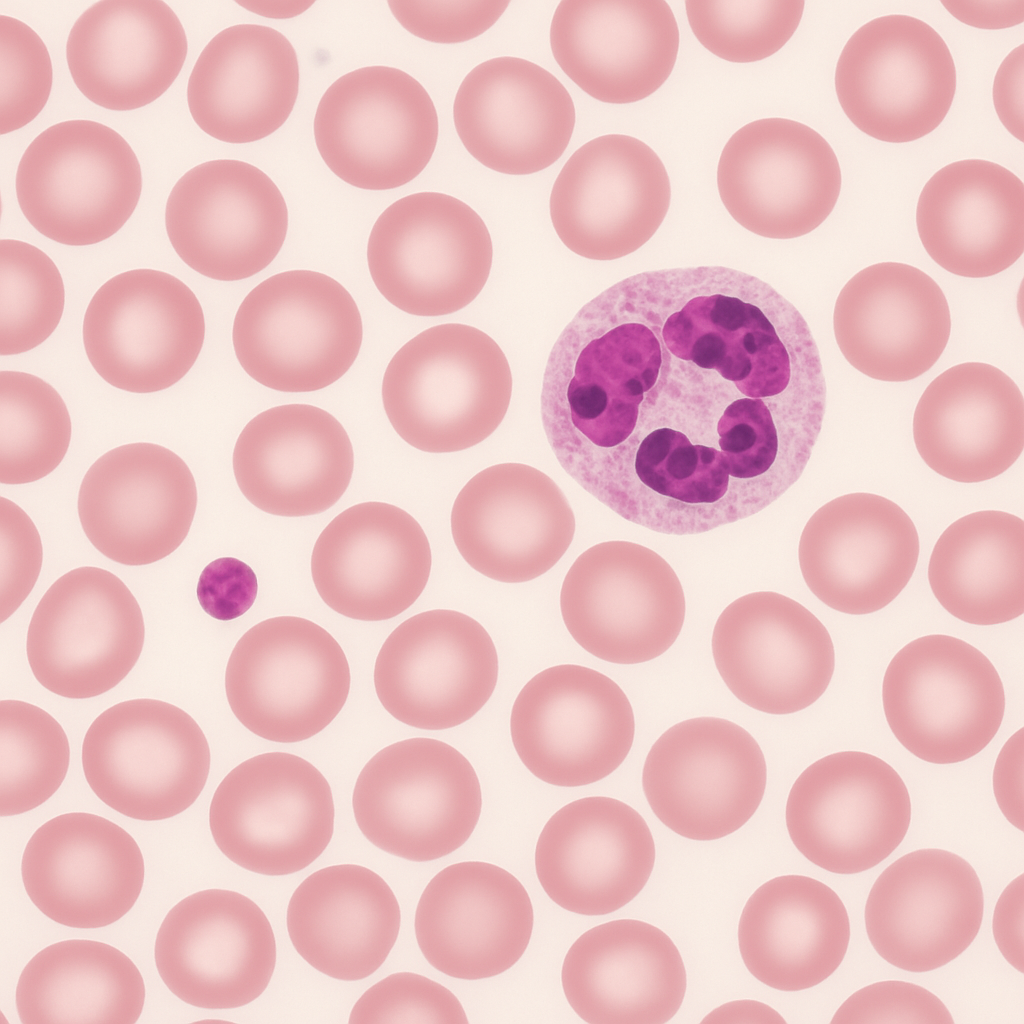
Peripheral blood smear at 60× oil immersion objective. Red blood cells fill the field showing detailed biconcave morphology with clear central pallor occupying roughly one-third of the cell diameter. A segmented neutrophil is visible with distinct nuclear lobes connected by thin chromatin strands, and fine pink cytoplasmic granules. Platelets appear as distinct granular bodies 2–3 μm in diameter. Fine morphological details such as Howell-Jolly bodies or basophilic stippling would be visible at this power.
60× oil immersion objective, NA 1.25. Enhanced morphological detail — nuclear chromatin pattern and cytoplasmic granules visible. Leica DM6 B — research-grade upright with motorized stage.
OpenAI gpt-image-1
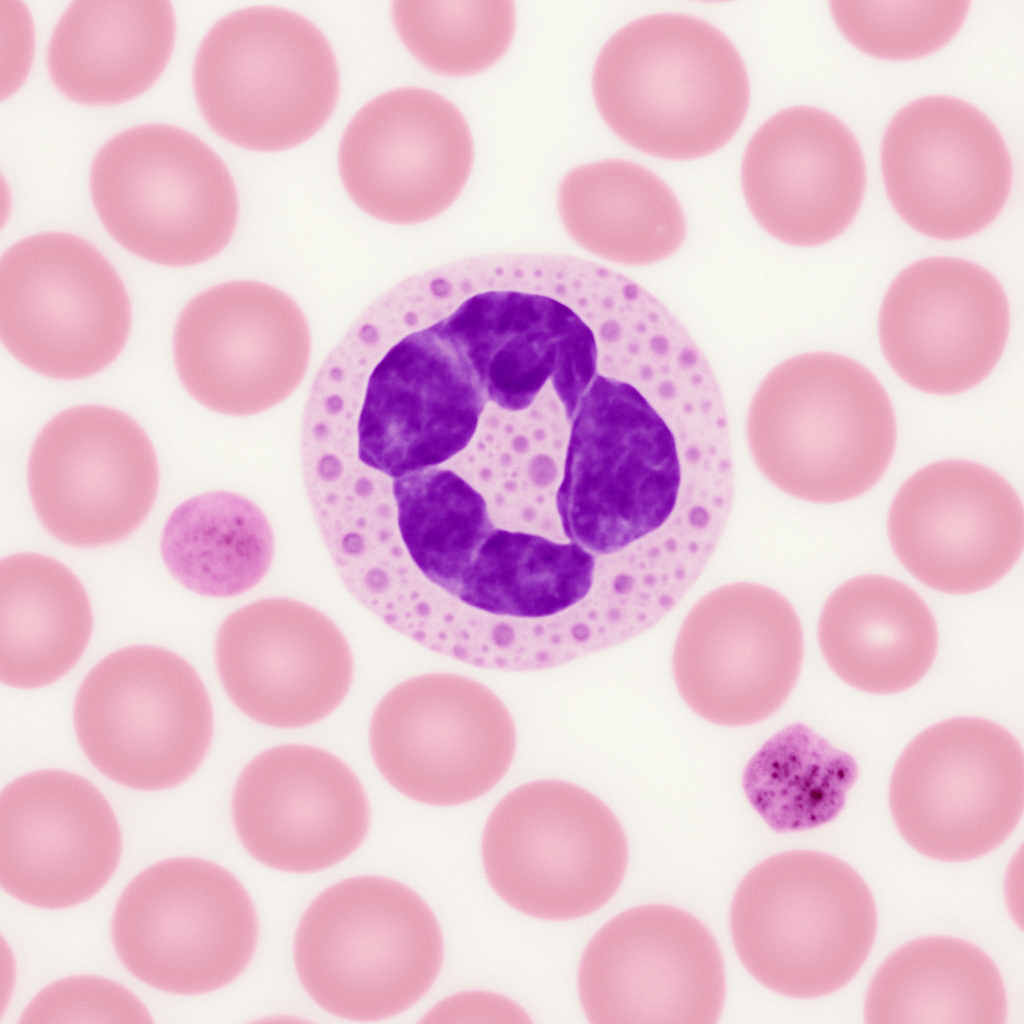
Wright-stained peripheral blood smear at 100× oil immersion — the highest useful magnification for light microscopy. Individual red blood cells are large in the field (7.5 μm), showing detailed biconcave disc morphology. A neutrophil dominates the view with multilobed nucleus (dark purple, 3–5 lobes connected by hair-thin chromatin filaments) and abundant pale pink cytoplasm with fine azurophilic granules. Platelets show internal granular structure. This is the gold-standard power for identifying intracellular parasites (malaria), inclusion bodies, and subtle morphological abnormalities.
100× oil immersion, NA 1.40. Maximum resolving power for light microscopy (200 nm resolution). Gold standard for blood cell morphology, parasite identification, and inclusion body detection. Zeiss Axio Imager 2 — plan-apochromatic 100×/1.40 oil objective.
OpenAI gpt-image-1
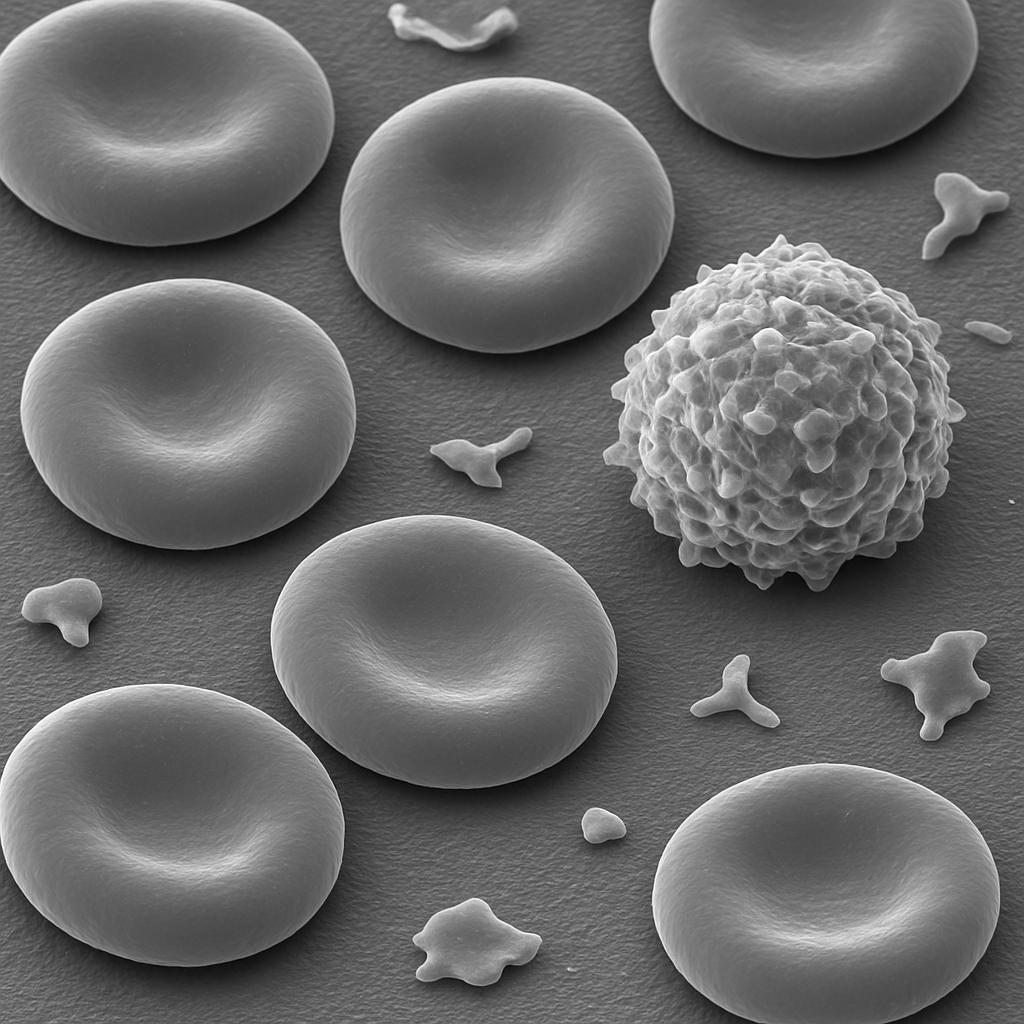
Scanning electron micrograph of a blood smear at 1,000× magnification. Multiple red blood cells are visible as smooth biconcave discs with their characteristic dimpled center, rendered in grayscale with 3D surface relief. The cells sit on the glass slide surface. A single larger white blood cell (leukocyte) is visible with a rough, ruffled surface membrane covered in microvilli. Scattered platelets appear as small irregularly shaped fragments. This magnification bridges light and high-resolution electron imaging.
1,000× SEM, secondary electron imaging. Gold-palladium sputter-coated specimen. 3D surface morphology replaces transmitted-light imaging. JEOL JSM-IT800 — intuitive SEM with Schottky FEG, 0.7 nm resolution.
OpenAI gpt-image-1
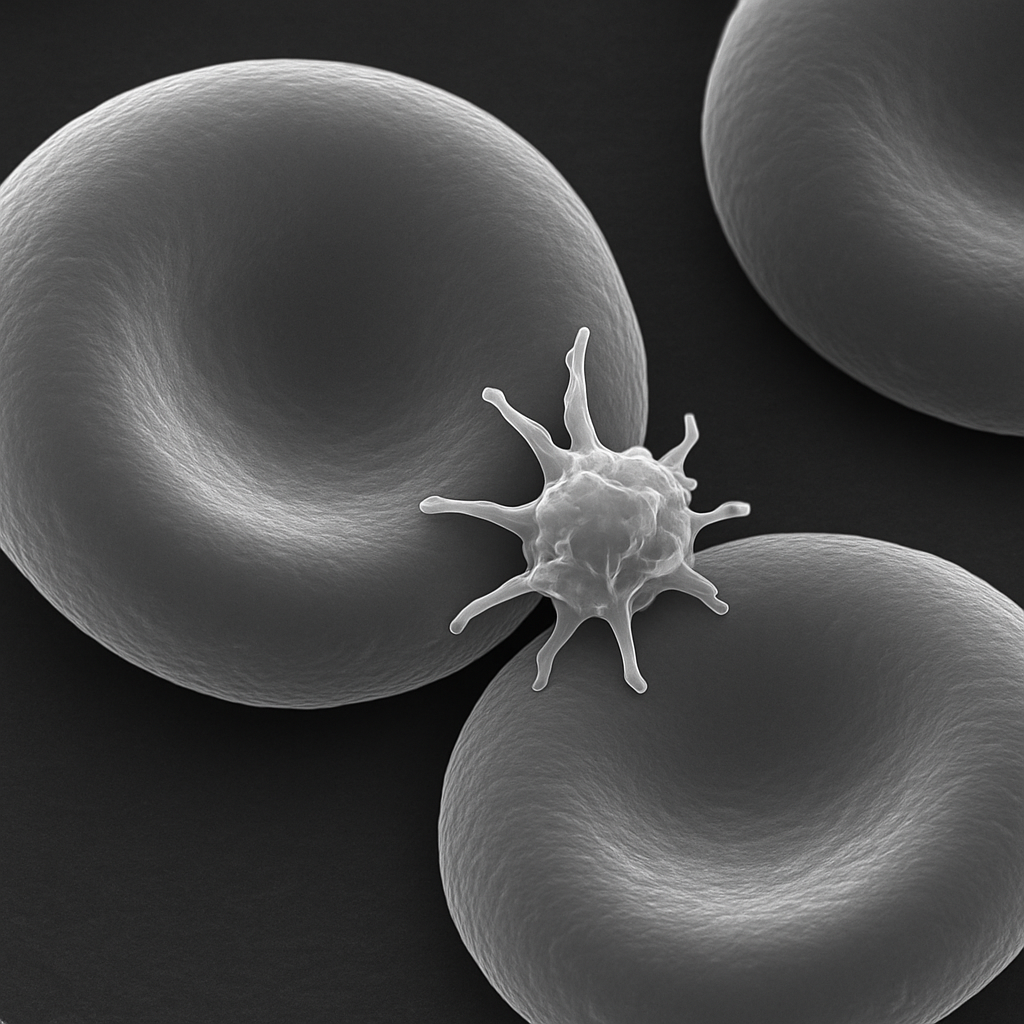
Scanning electron micrograph at 5,000× showing two to three red blood cells in detail. The biconcave disc shape is dramatically rendered in 3D with the central depression clearly visible. Surface texture is smooth with subtle membrane undulations. A single platelet adheres to an erythrocyte surface, showing its irregular discoid shape with extended pseudopods. The image is grayscale with bright surface highlights and deep shadow contrast typical of secondary electron SEM imaging.
5,000× FE-SEM, secondary electron detector. Surface ultrastructure reveals membrane topology. Individual cell surface features resolved. Hitachi SU9000 — ultra-high resolution FE-SEM, 0.4 nm resolution at 30 kV.
OpenAI gpt-image-1
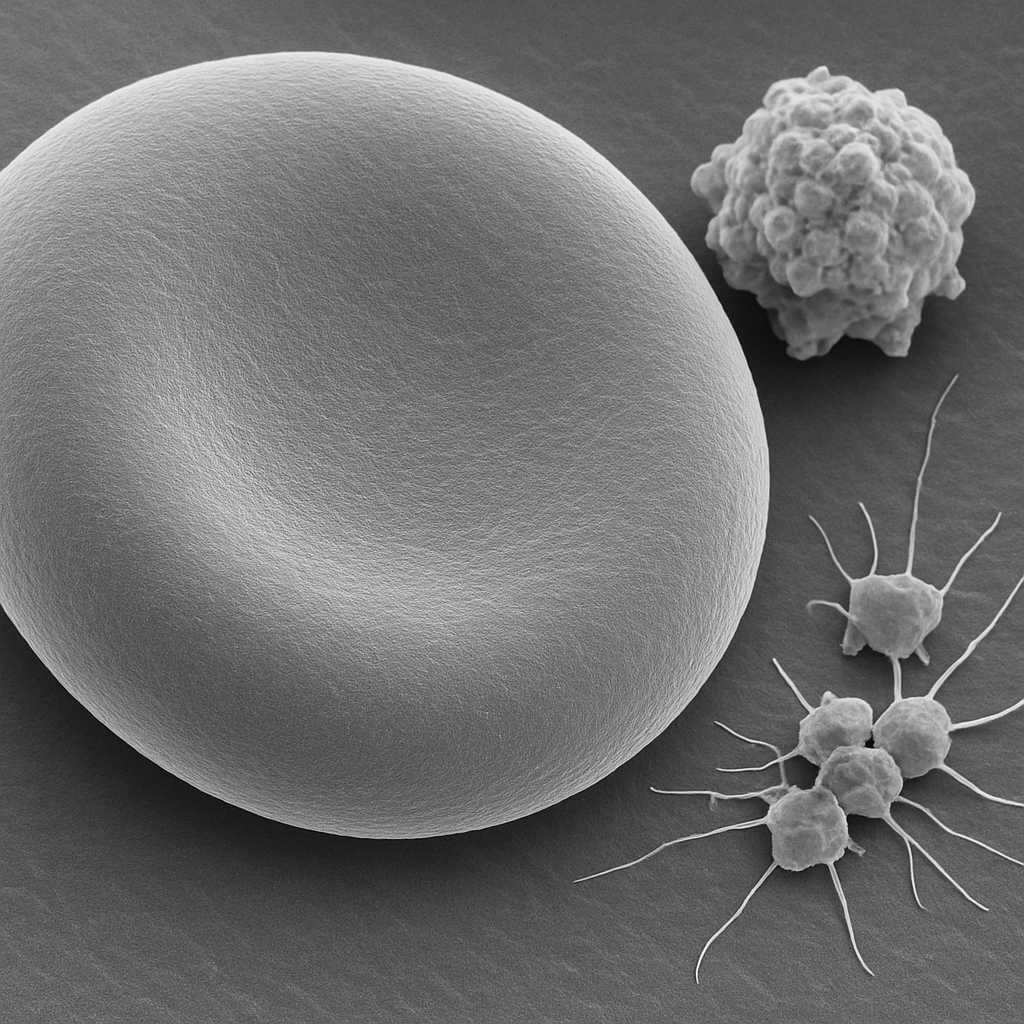
SEM image at 10,000× magnification focused on the surface of a single red blood cell. The smooth lipid bilayer membrane is visible with subtle surface texture. The edge of the biconcave disc shows the membrane curvature in dramatic 3D relief. At this magnification, the spectrin cytoskeletal network beneath the membrane creates a faint textured pattern on the cell surface. A small cluster of activated platelets is visible nearby with extended filopodia.
10,000× FE-SEM. Red blood cell membrane detail — spectrin network imprint visible. Platelet filopodia resolved. Hitachi SU9000 — 0.4 nm resolution, in-lens SE detector.
OpenAI gpt-image-1
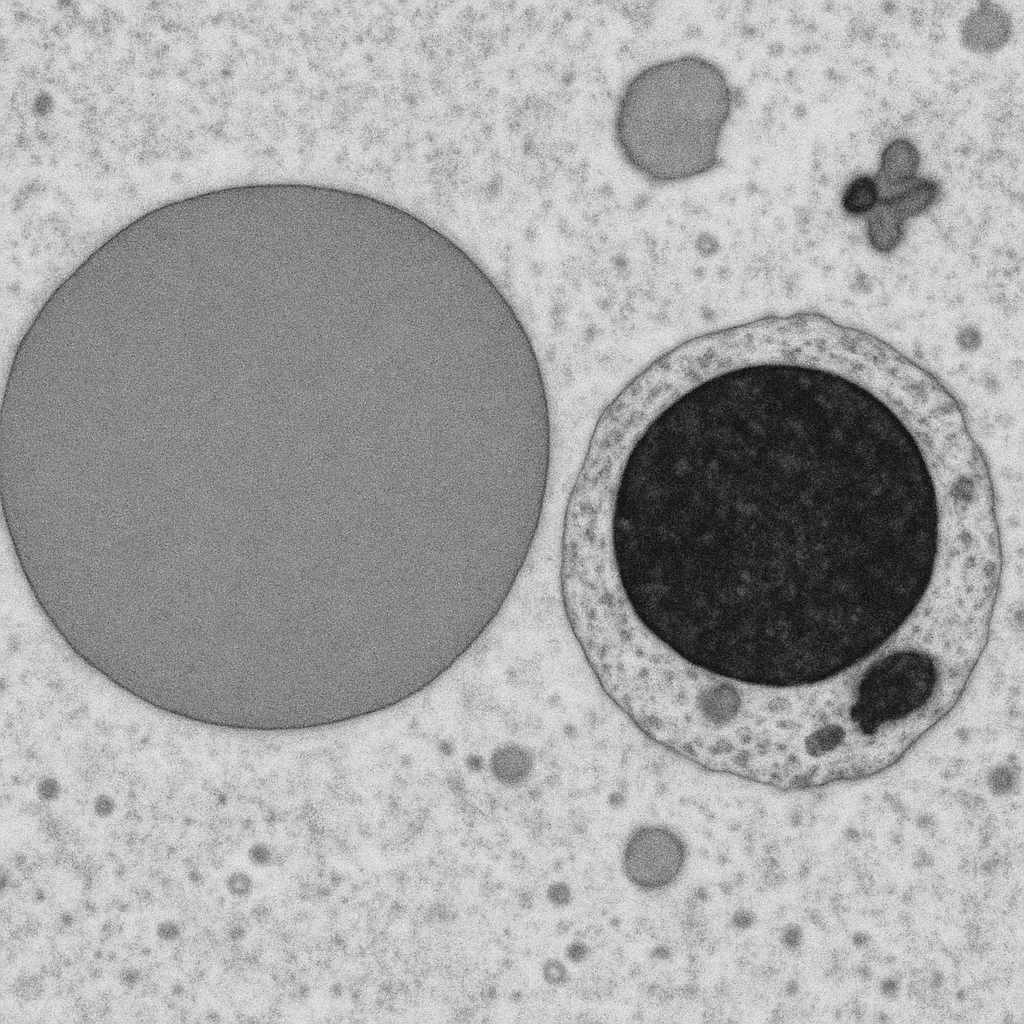
Transmission electron micrograph at 25,000× of an ultrathin section (70 nm) through peripheral blood cells. A cross-section through a red blood cell shows the electron-dense hemoglobin filling the cytoplasm as uniform gray, bounded by the dark lipid bilayer membrane. No nucleus or organelles are present — characteristic of mature mammalian erythrocytes. Adjacent, a cross-section through a lymphocyte shows a large round electron-dense nucleus with condensed heterochromatin along the nuclear envelope, surrounded by a thin rim of cytoplasm containing scattered ribosomes.
25,000× TEM, 200 kV accelerating voltage. Ultrathin section (70 nm) stained with uranyl acetate and lead citrate. RBC shows homogeneous hemoglobin, lymphocyte shows heterochromatin. JEOL JEM-F200 — cold FEG TEM, 0.19 nm point resolution.
OpenAI gpt-image-1
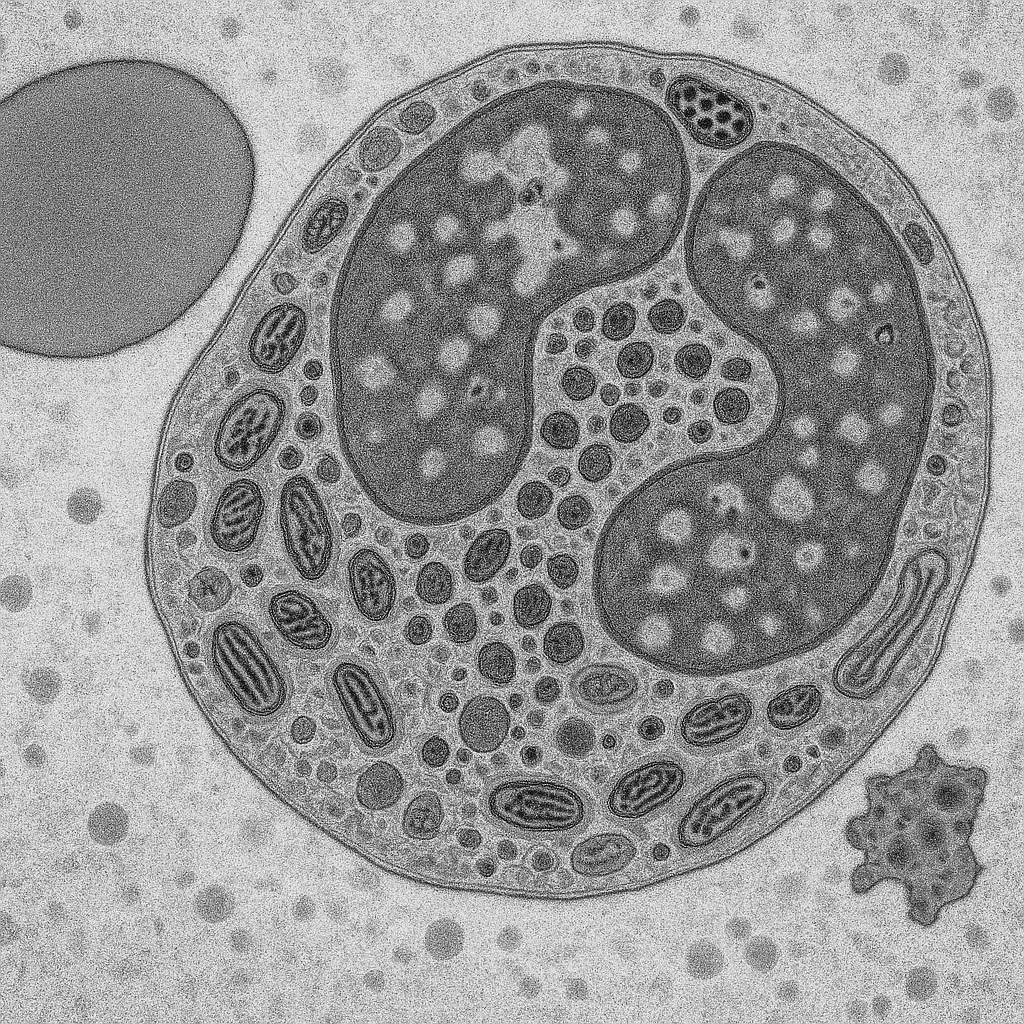
TEM micrograph at 50,000× magnification showing a cross-section through a neutrophil granulocyte. The multilobed nucleus shows distinct euchromatin (light gray) and heterochromatin (dark, electron-dense) regions. The nuclear envelope with visible nuclear pores is clearly resolved. The cytoplasm contains numerous electron-dense specific granules (100–300 nm) and larger azurophilic granules. Mitochondria with cristae, rough endoplasmic reticulum, and Golgi apparatus are visible as distinct organelles.
50,000× TEM, 200 kV. Neutrophil ultrastructure — specific and azurophilic granules, nuclear pores, mitochondrial cristae resolved. Thermo Fisher Talos F200X G2 — 0.12 nm STEM resolution, S/TEM with Super-X EDS.
OpenAI gpt-image-1
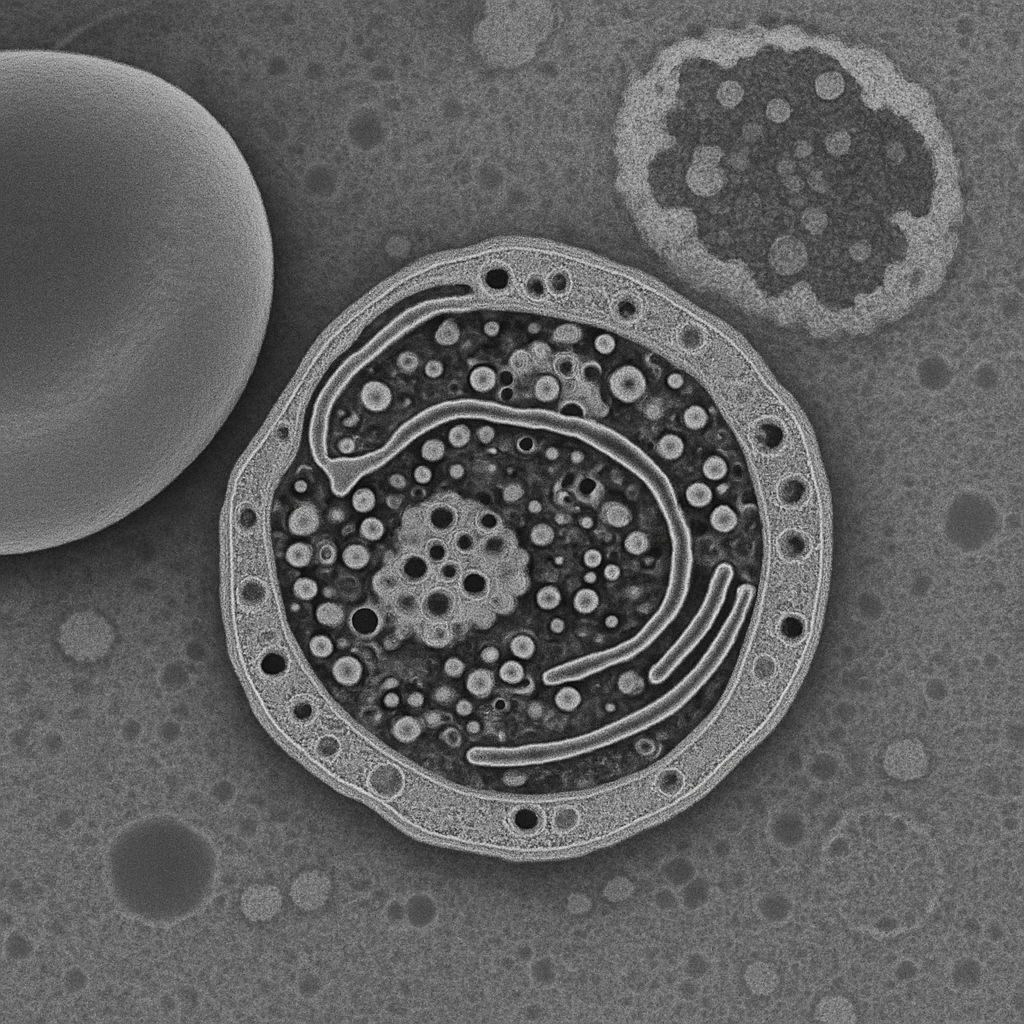
High-magnification TEM at 100,000× showing the ultrastructural detail of a platelet (thrombocyte) cross-section. The platelet's open canalicular system appears as membrane-lined channels throughout the cytoplasm. Dense granules (electron-dense, 150–200 nm) and alpha granules (moderate density, 200–400 nm) are clearly distinguished. Glycogen particles appear as electron-dense dots. Microtubules of the marginal band are visible as hollow cylindrical structures (25 nm diameter) running along the platelet periphery. The lipid bilayer membrane is resolved as a dark line approximately 7 nm thick.
100,000× TEM, 200 kV. Platelet ultrastructure — open canalicular system, dense and alpha granules, marginal band microtubules, and membrane bilayer resolved. Thermo Fisher Talos F200X G2 — cryo-capable, 0.12 nm S/TEM resolution.
OpenAI gpt-image-1
Compatible Microscopes
| Model | Manufacturer | Type | Magnification Range | NA Max | Resolution |
|---|---|---|---|---|---|
| HT7800 | Hitachi High-Tech | Tem | 200–600000× | — | — nm |
| Regulus 8200 | Hitachi High-Tech | Fe Sem | 20–2000000× | — | 0.6 nm |
| JEM-F200 | JEOL | Tem | 50–1500000× | — | — nm |
| JSM-IT800 | JEOL | Sem | 5–1000000× | — | 0.7 nm |
| JSM-7900F | JEOL | Fe Sem | 25–1000000× | — | 0.5 nm |
| BZ-X810 | Keyence | Fluorescence All In One | 2–100× | 1.45 | 190 nm |
| VHX-7000 | Keyence | Digital Microscope | 0.1–6000× | — | 100 nm |
| DM6 B | Leica Microsystems | Upright Optical | 1.25–100× | 1.4 | 200 nm |
| DMi8 | Leica Microsystems | Inverted Optical | 2.5–100× | 1.47 | 185 nm |
| Eclipse Ti2 | Nikon | Inverted Optical | 2–100× | 1.45 | 190 nm |
| Eclipse Ni | Nikon | Upright Optical | 2–100× | 1.4 | 200 nm |
| BX53 | Olympus (Evident) | Upright Optical | 2–100× | 1.4 | 200 nm |
| IX83 | Olympus (Evident) | Inverted Optical | 2–100× | 1.4 | 200 nm |
| Apreo 2 | Thermo Fisher Scientific | Fe Sem | 13–2000000× | — | 0.7 nm |
| Axio Observer 7 | Zeiss | Inverted Optical | 5–100× | 1.4 | 200 nm |
| Axio Imager 2 | Zeiss | Upright Optical | 1.25–100× | 1.4 | 200 nm |
| Primostar 3 | Zeiss | Upright Optical | 4–100× | 1.25 | 350 nm |
Edit Image Metadata
AI Generate Image — AI Peripheral Blood Smear
Fill in the imaging criteria below. A detailed prompt will be built from your selections and sent to OpenAI to generate a realistic microscopy image.