AI Cardiac
AI Cardiac
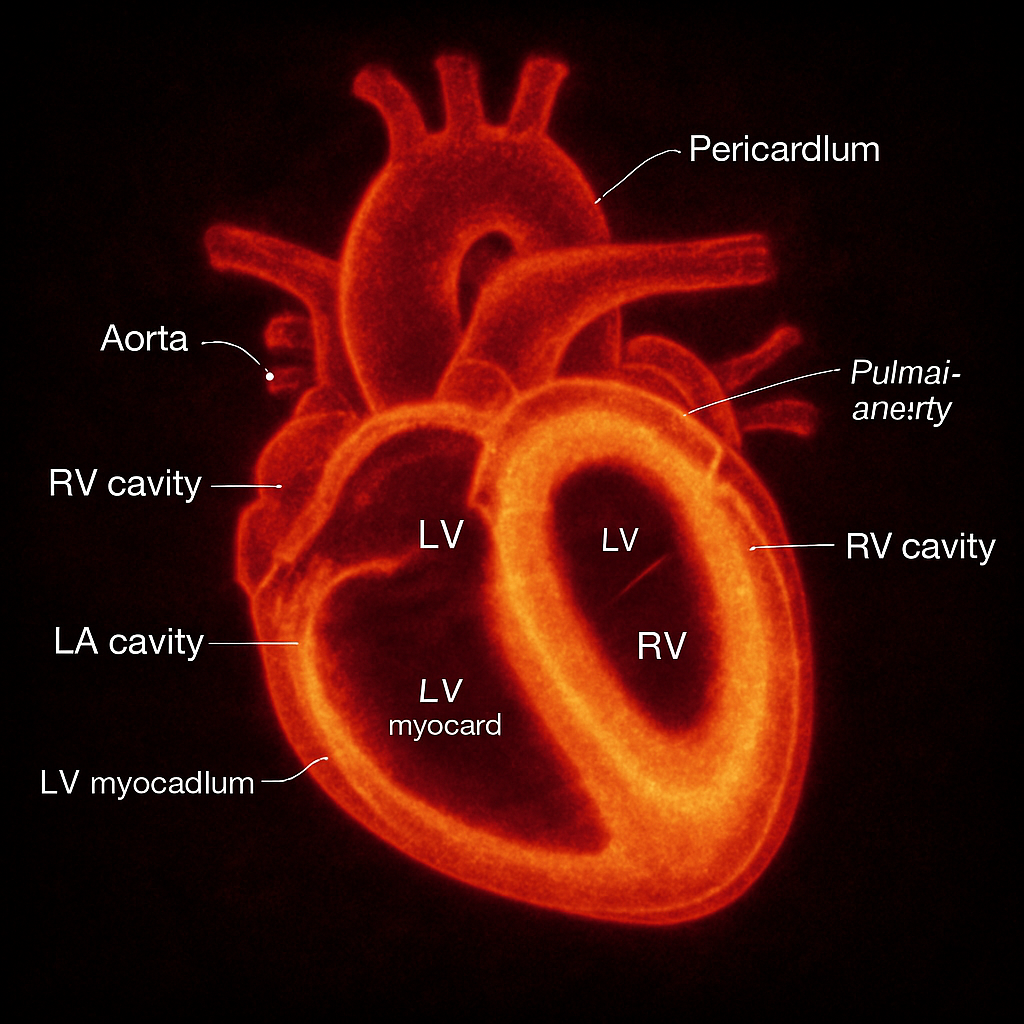
HeartAI-generated comprehensive cardiac phantom with all four chambers, valves, coronary arteries, great vessels, pericardium, and surrounding structures for multi-modality cardiac imaging training
Image Library
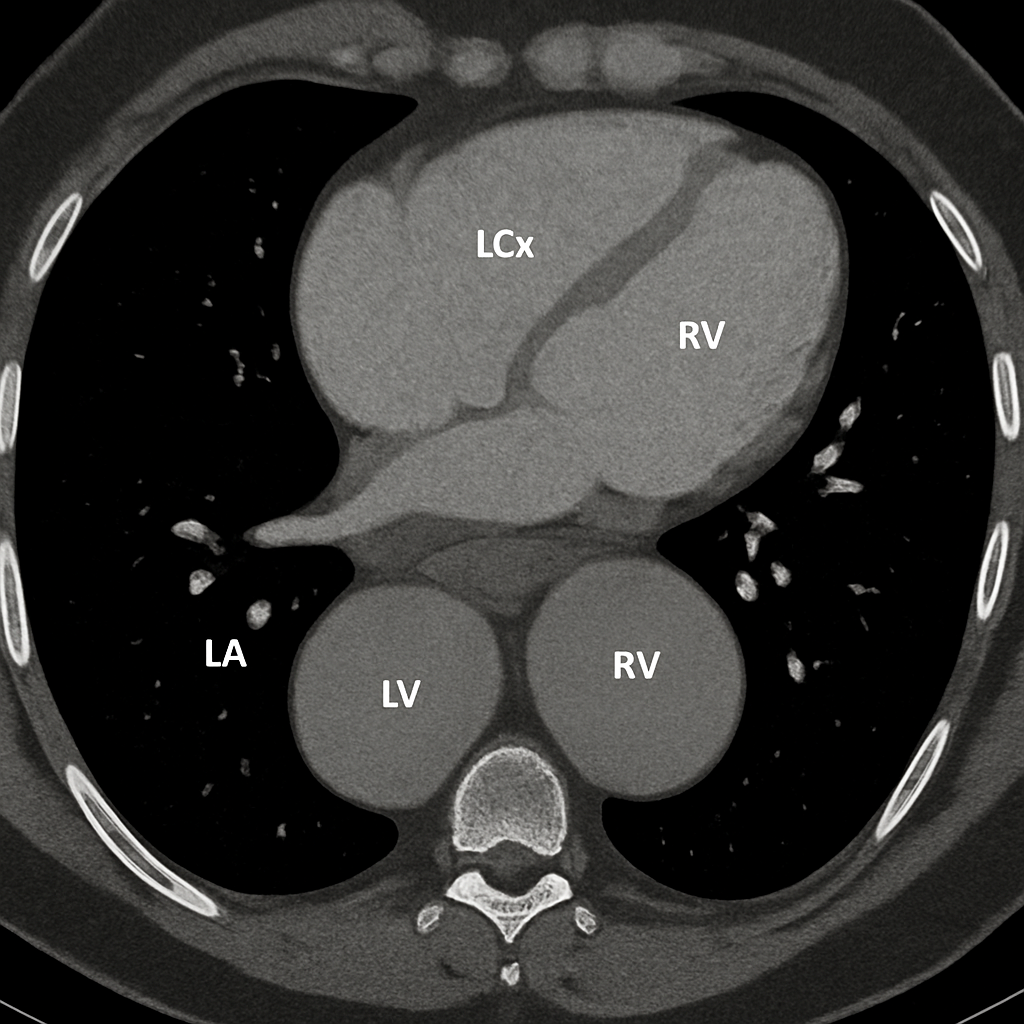
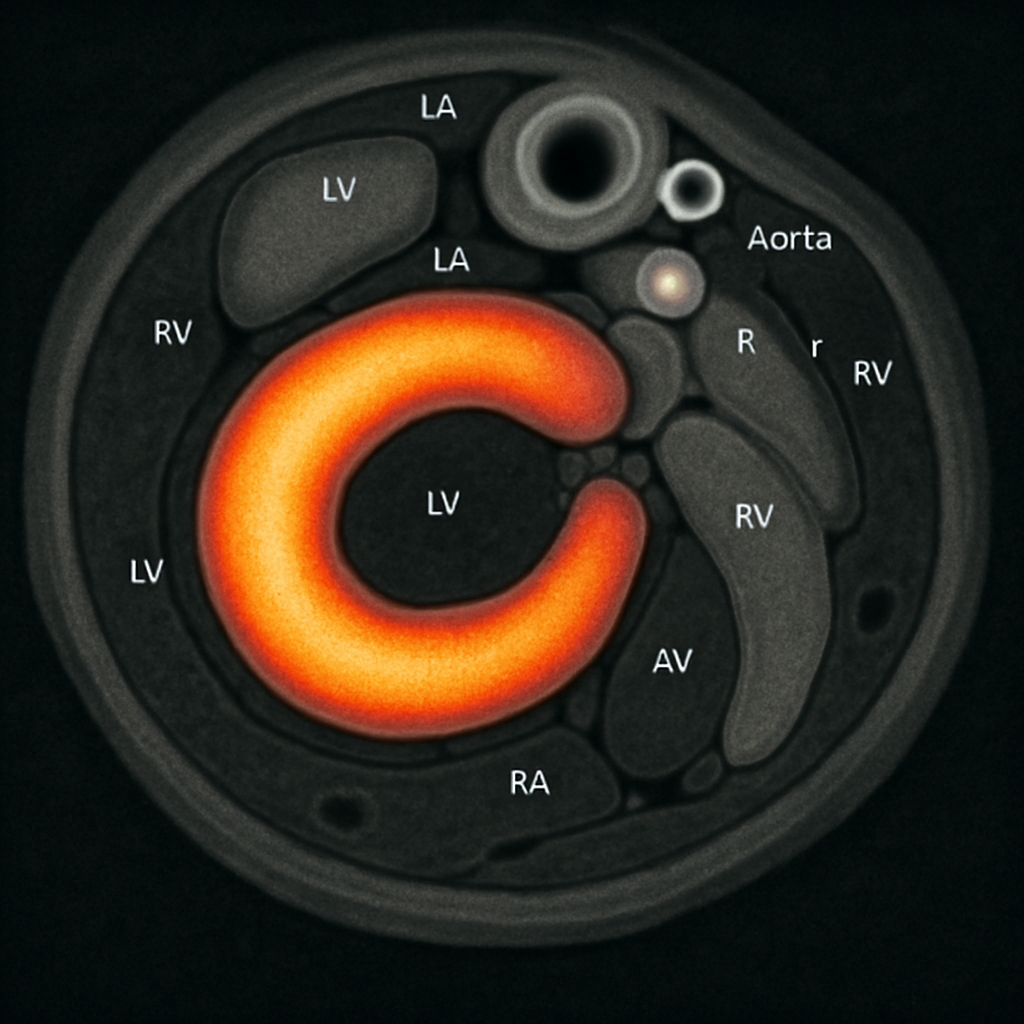
Axial non-contrast CT of the heart showing all four chambers, myocardium, pericardium, and coronary artery calcifications. Soft tissue window.
Non-contrast cardiac CT for calcium scoring; show LAD, LCx, RCA calcifications
OpenAI gpt-image-1
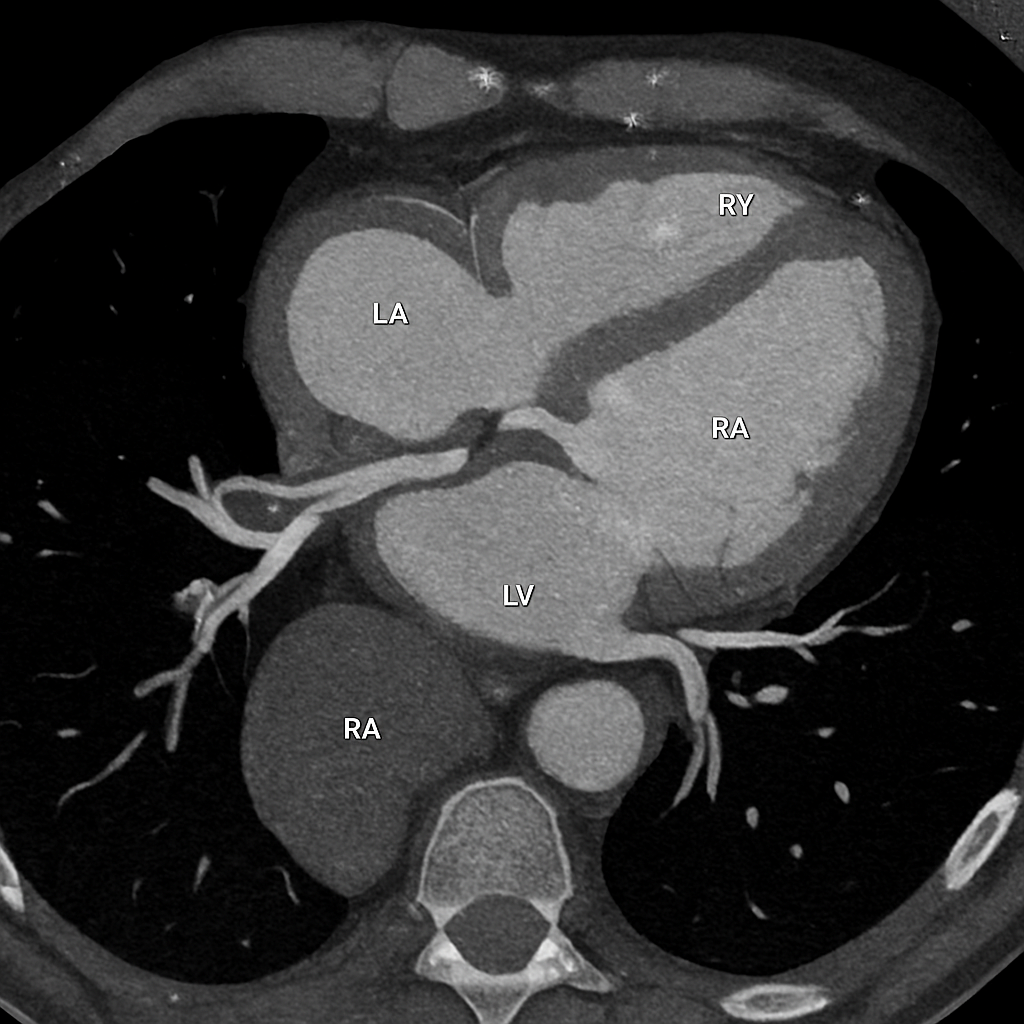
ECG-gated coronary CT angiography showing contrast-enhanced coronary arteries (LAD, LCx, RCA) with clear lumen. Axial view at the level of the aortic root.
Coronary CTA with IV iodinated contrast, ECG-gated, diastolic phase. Show opacified coronary arteries.
OpenAI gpt-image-1
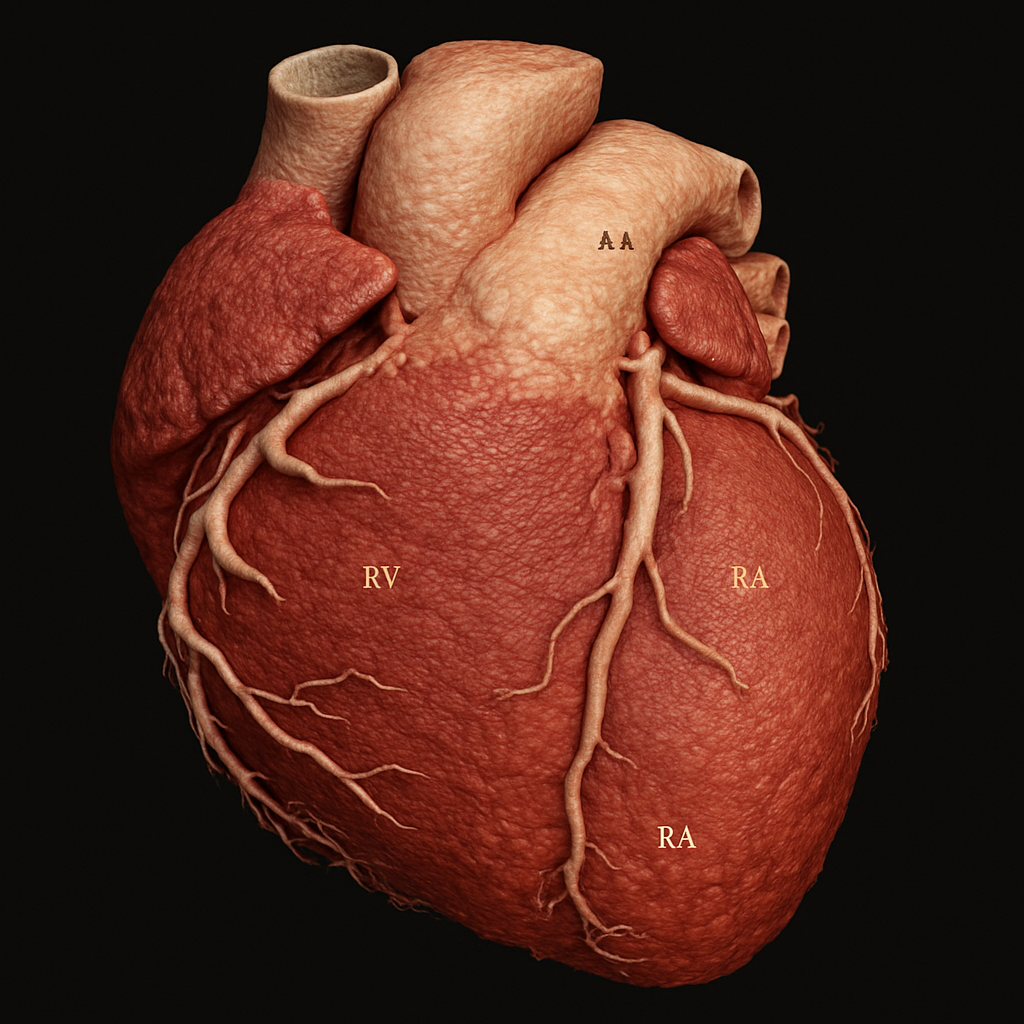
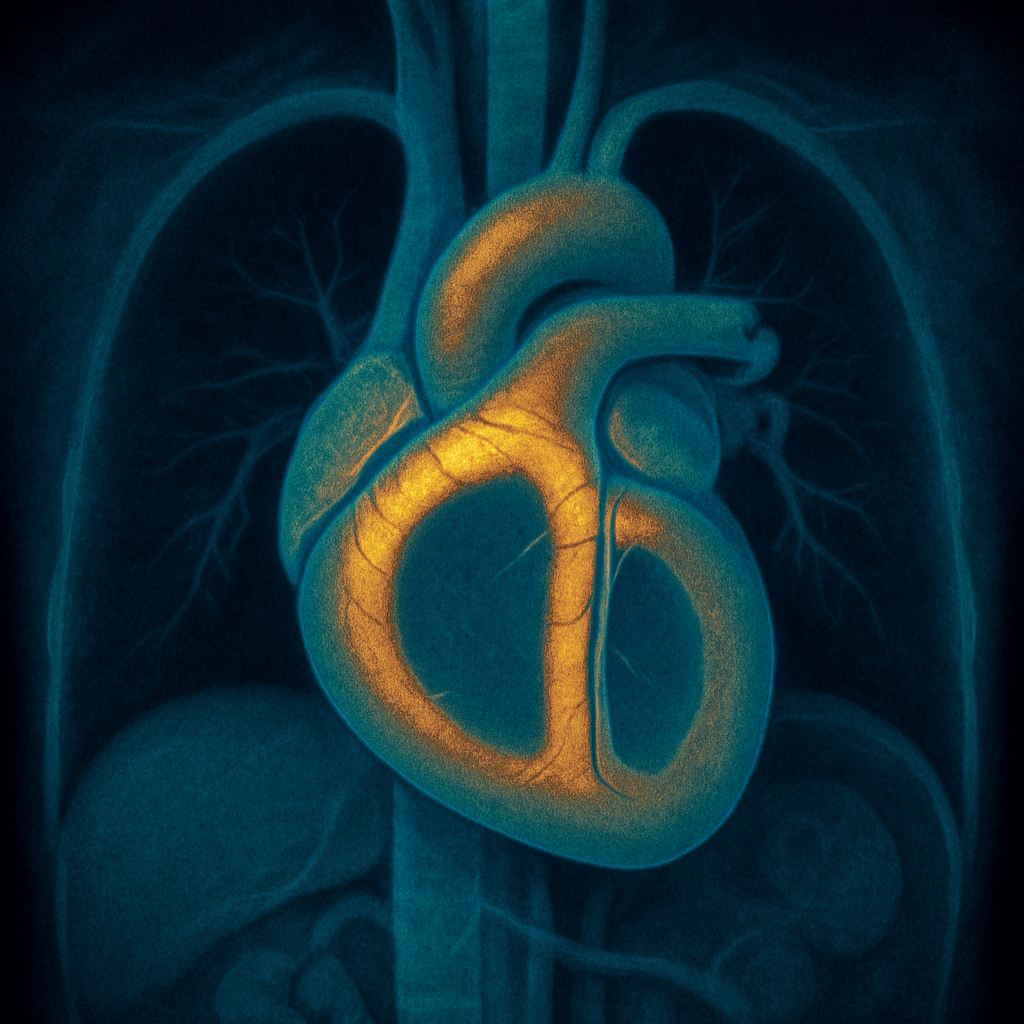
3D volume-rendered reconstruction of the heart and coronary arteries from CT angiography data. External view showing the LAD, LCx, and RCA coursing over the cardiac surface.
3D volume rendering showing coronary artery tree on cardiac surface, cinematic rendering style
OpenAI gpt-image-1
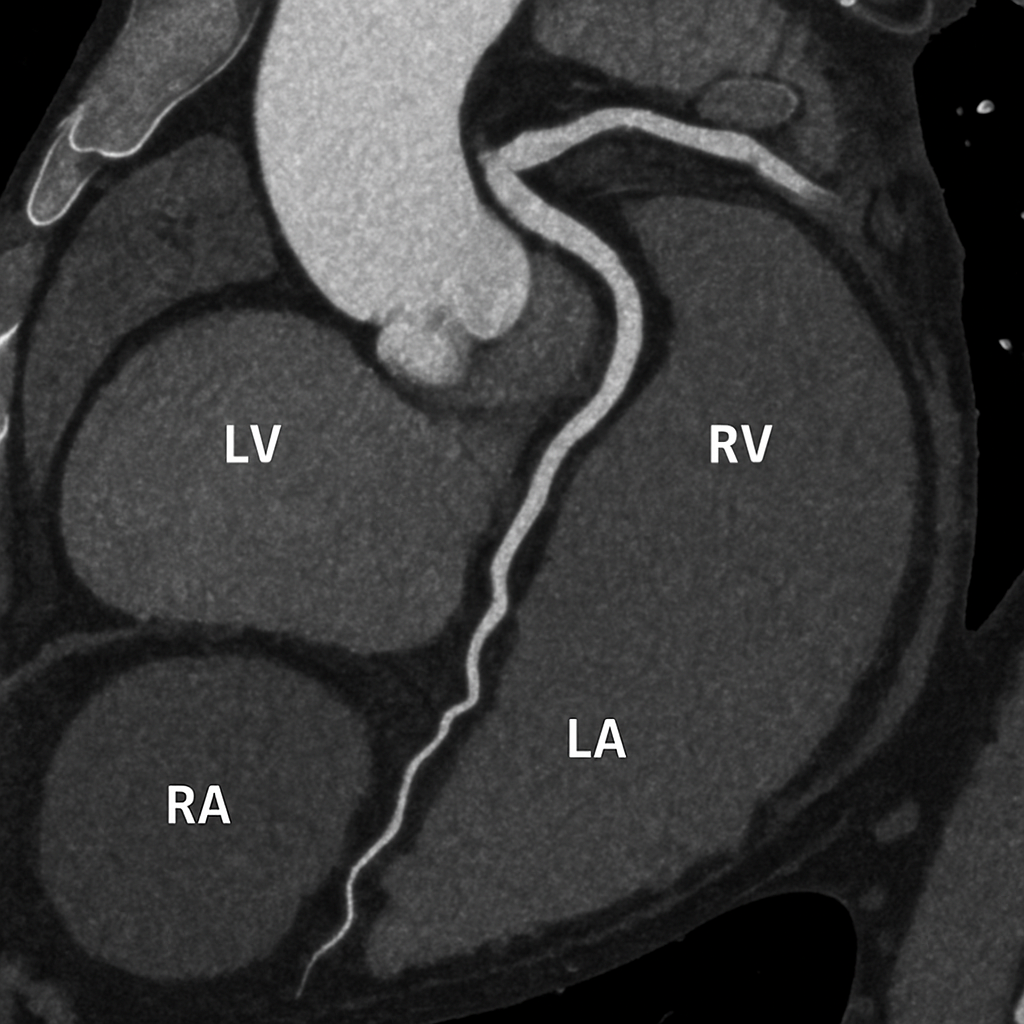
Curved multiplanar reformation (MPR) of the left anterior descending artery from coronary CTA, showing the full length of the LAD from ostium to distal segment.
Curved MPR along LAD centerline; show contrast-filled lumen and vessel wall
OpenAI gpt-image-1
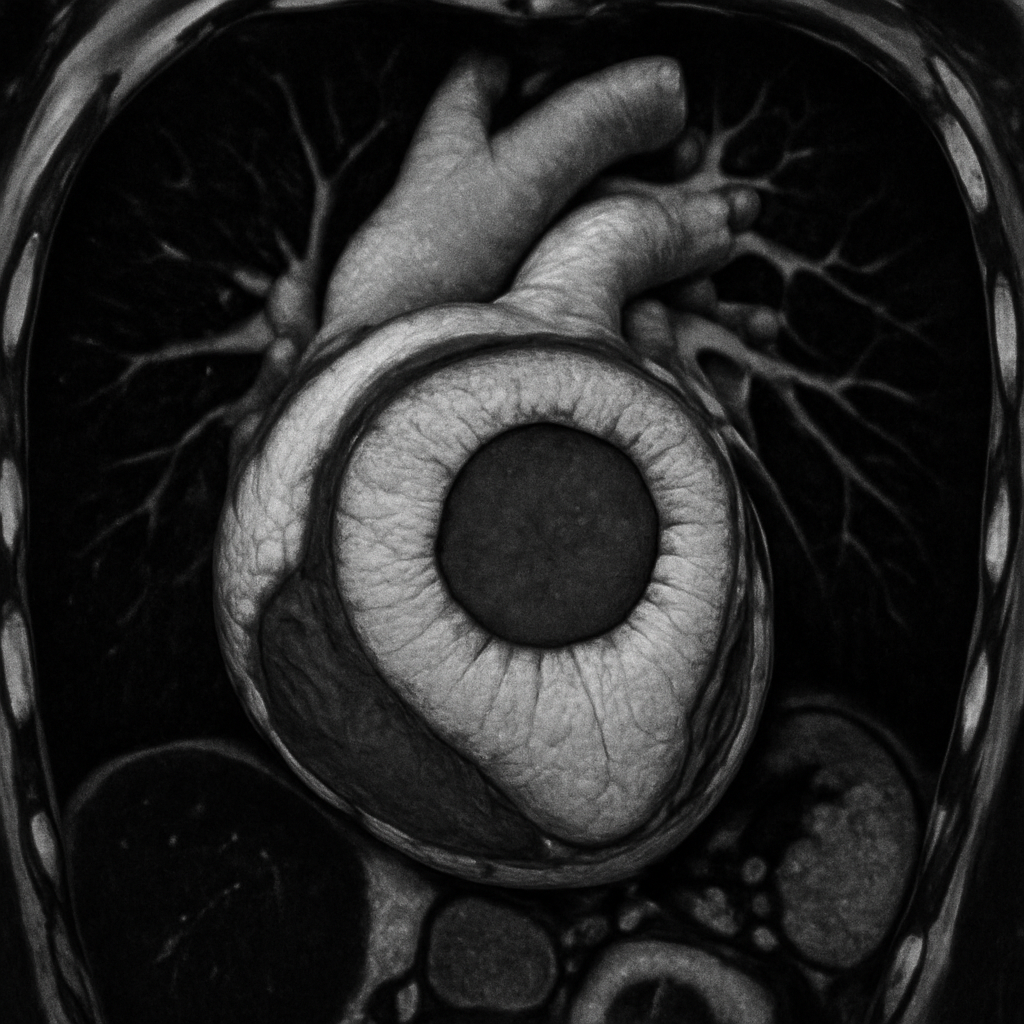
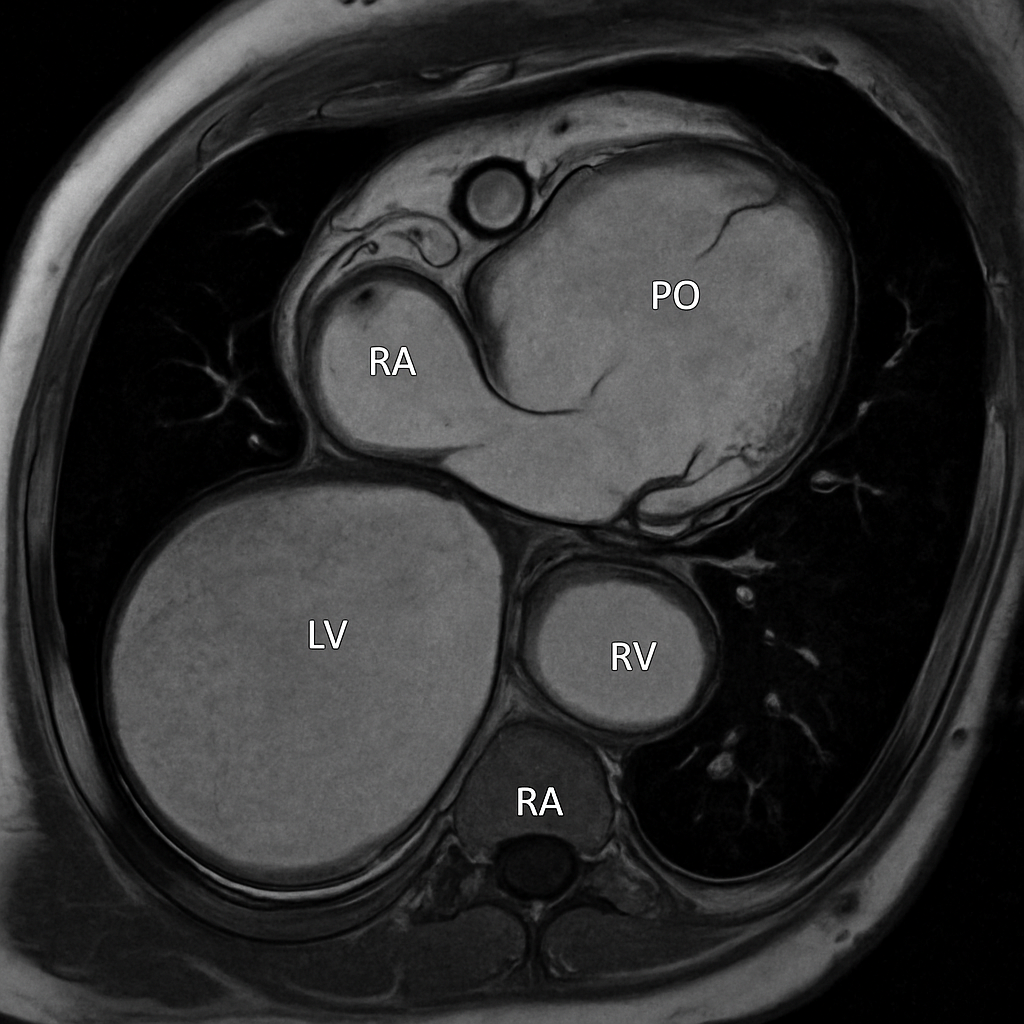
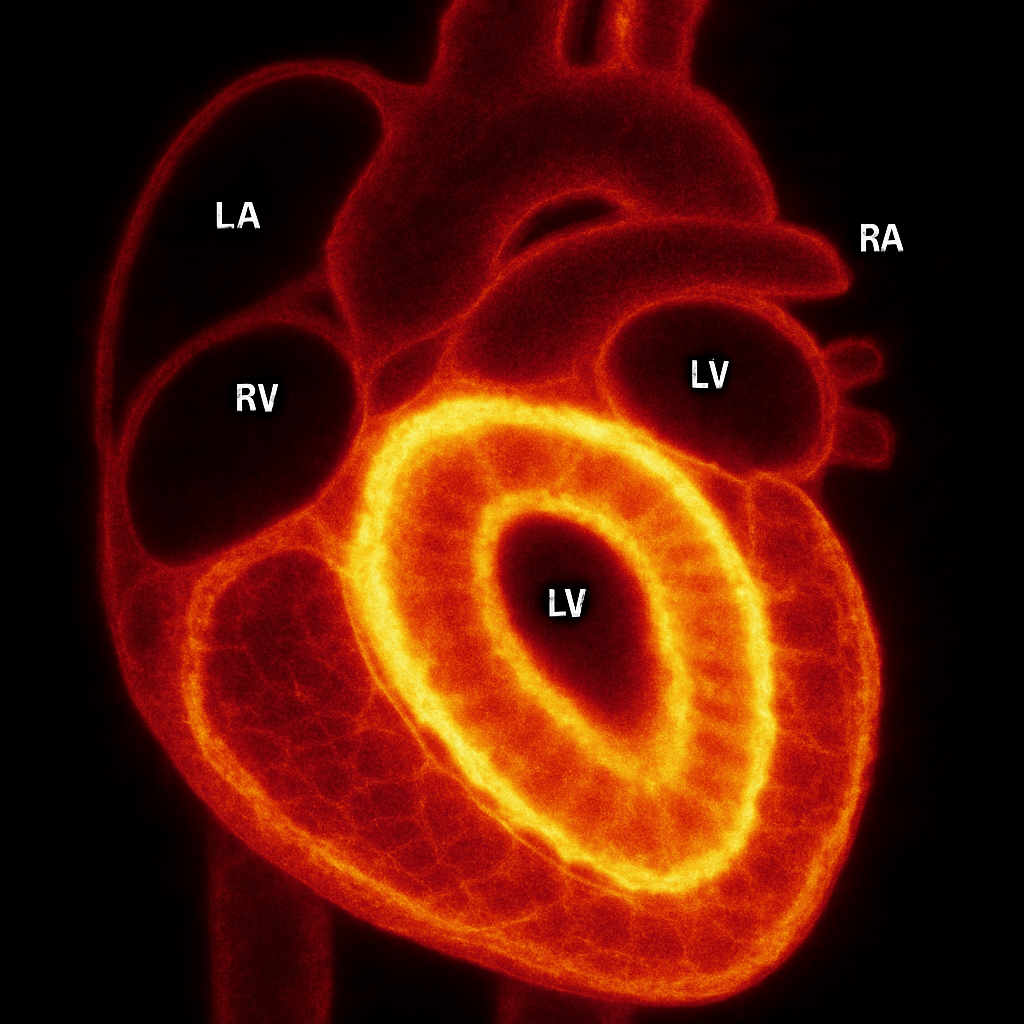
Cardiac MRI short-axis (SA) view at mid-ventricular level during end-diastole. Balanced SSFP sequence showing bright blood in LV and RV cavities, dark myocardium, papillary muscles.
bSSFP cine, mid-ventricular short axis, end-diastolic frame. Bright blood pool, dark myocardium.
OpenAI gpt-image-1
Cardiac MRI short-axis (SA) view at mid-ventricular level during end-systole. SSFP sequence showing thickened myocardium and small LV cavity.
bSSFP cine, mid-ventricular short axis, end-systolic frame. Show concentric LV wall thickening.
OpenAI gpt-image-1
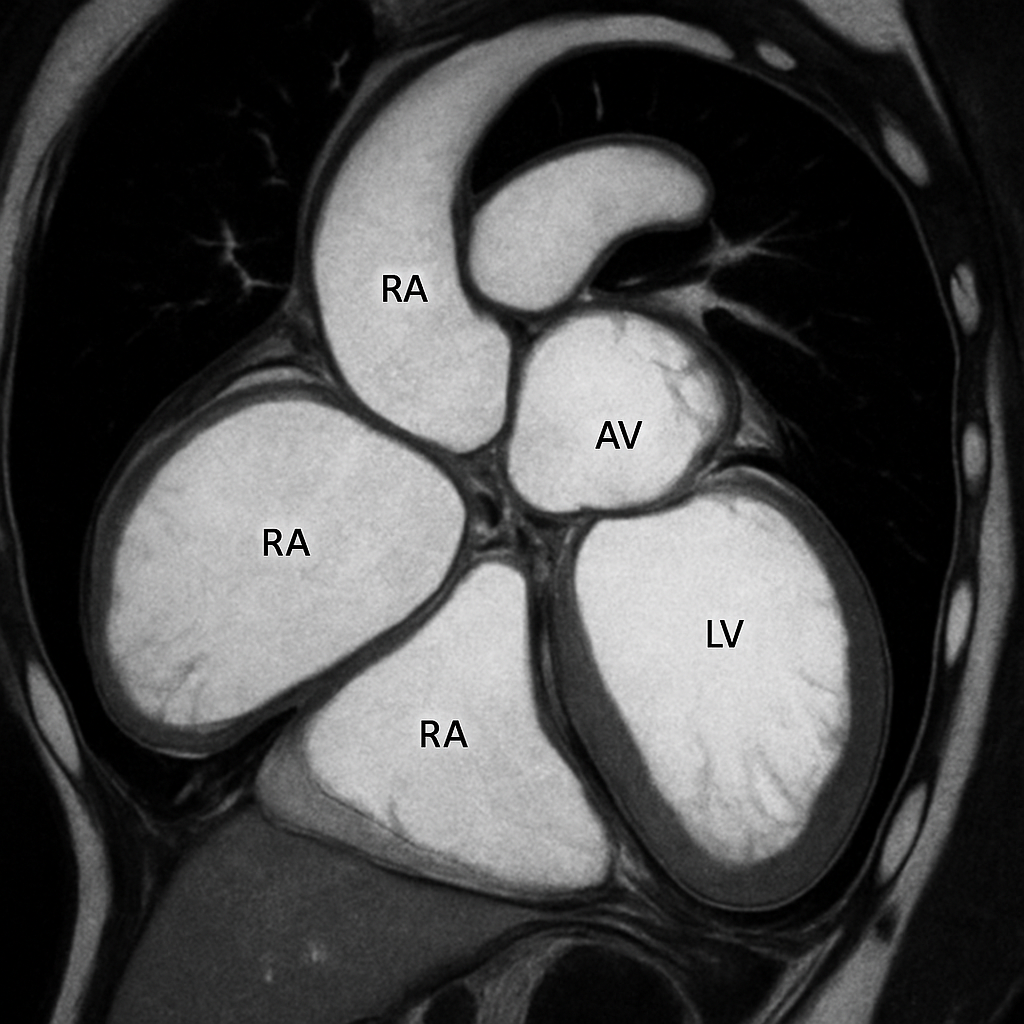
Cardiac MRI four-chamber (4CH) long-axis view showing all four chambers, both AV valves (mitral and tricuspid), interventricular and interatrial septa. SSFP bright-blood.
bSSFP cine, four-chamber view. Show all chambers, AV valves, septa. Bright blood.
OpenAI gpt-image-1
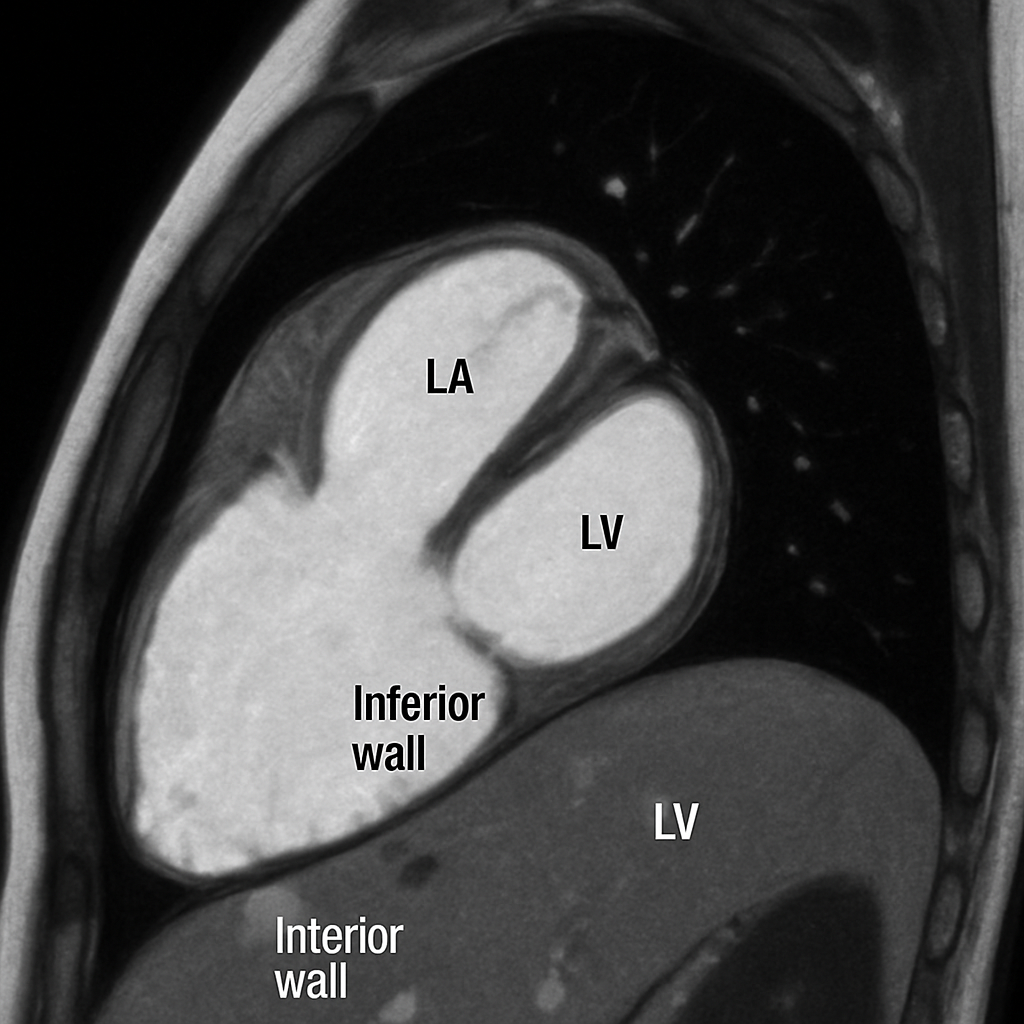
Cardiac MRI two-chamber (2CH) long-axis view showing left atrium, mitral valve, and left ventricle with anterior and inferior walls. SSFP bright-blood.
bSSFP cine, two-chamber view (vertical long axis). Show LA, MV, LV anterior and inferior walls.
OpenAI gpt-image-1

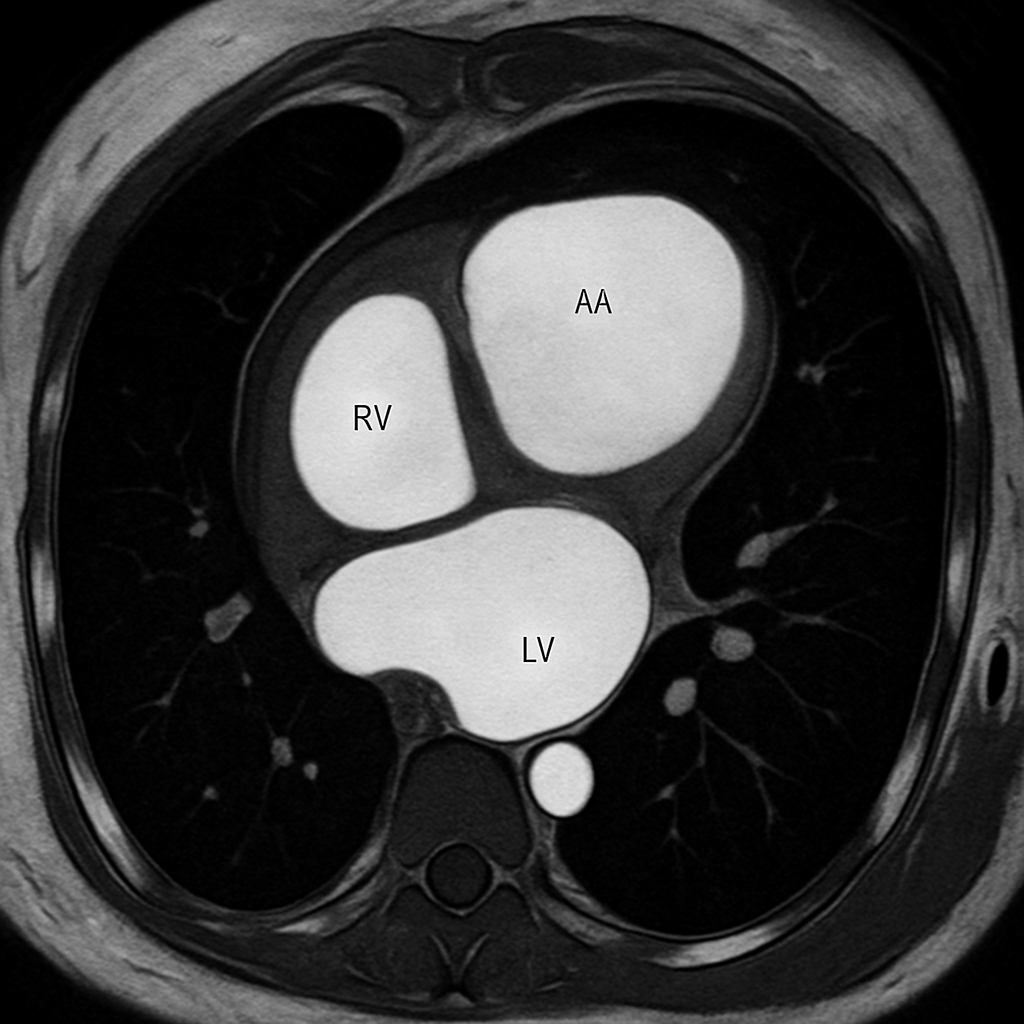
Cardiac MRI three-chamber view showing the left ventricular outflow tract (LVOT), aortic valve, ascending aorta, LV, and LA. SSFP bright-blood.
bSSFP cine, three-chamber / LVOT view. Show aortic valve, ascending aorta, LV, LA.
OpenAI gpt-image-1
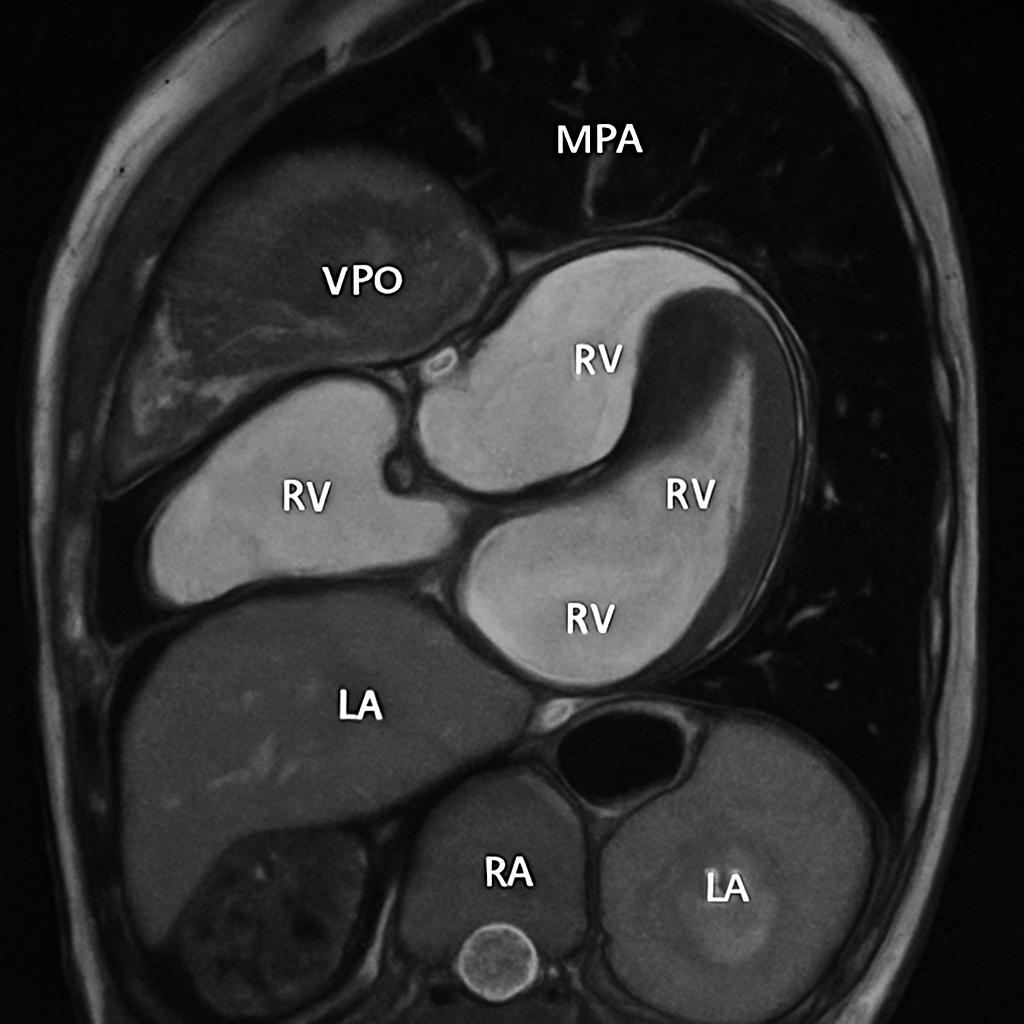
Cardiac MRI right ventricular outflow tract (RVOT) view showing the RV, pulmonary valve, and main pulmonary artery. SSFP bright-blood.
bSSFP cine, RVOT view. Show RV, pulmonary valve, and MPA.
OpenAI gpt-image-1
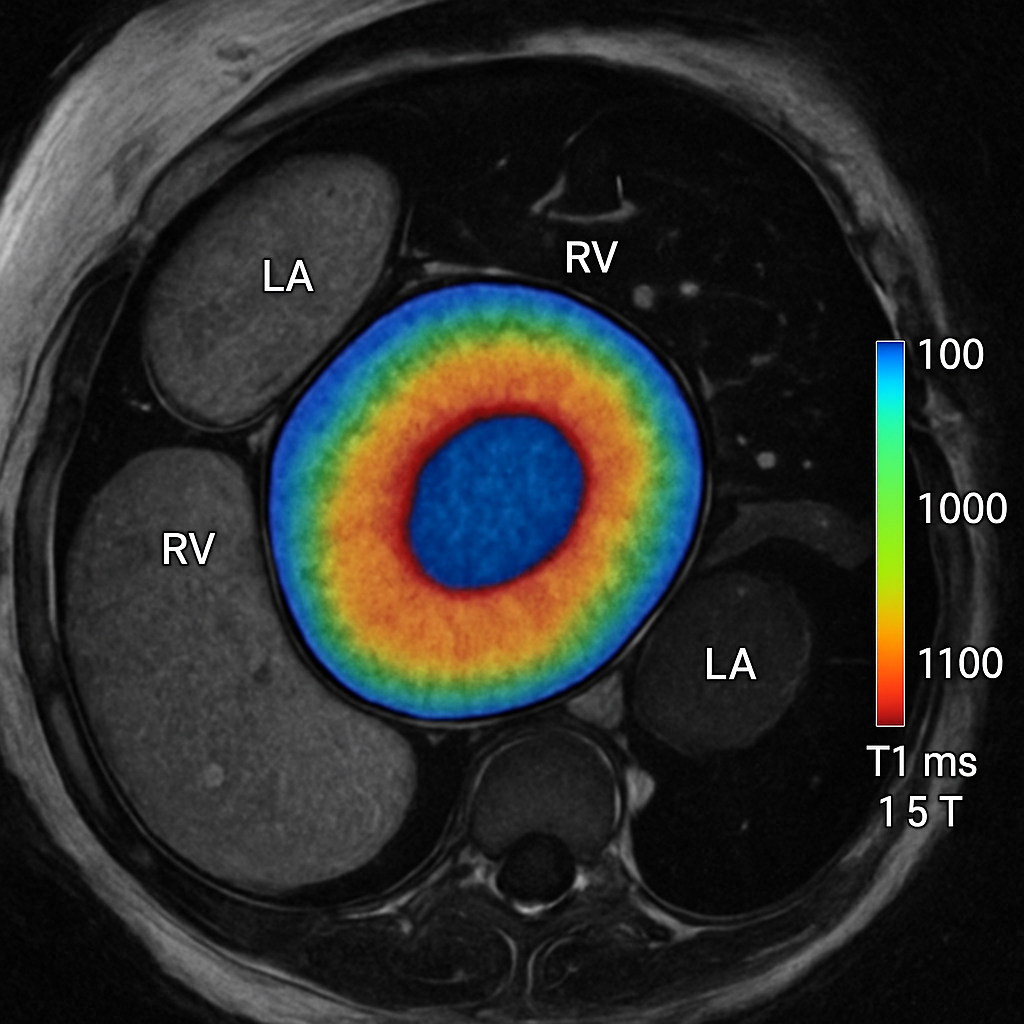
Native T1 mapping of the heart in short-axis view with color overlay showing myocardial T1 values. Color scale from blue (low T1) to red (high T1). Normal myocardial T1 ~1000ms at 1.5T.
Native T1 map, short axis, color-coded. Normal T1 ~1000ms at 1.5T. Show left ventricle with color overlay.
OpenAI gpt-image-1
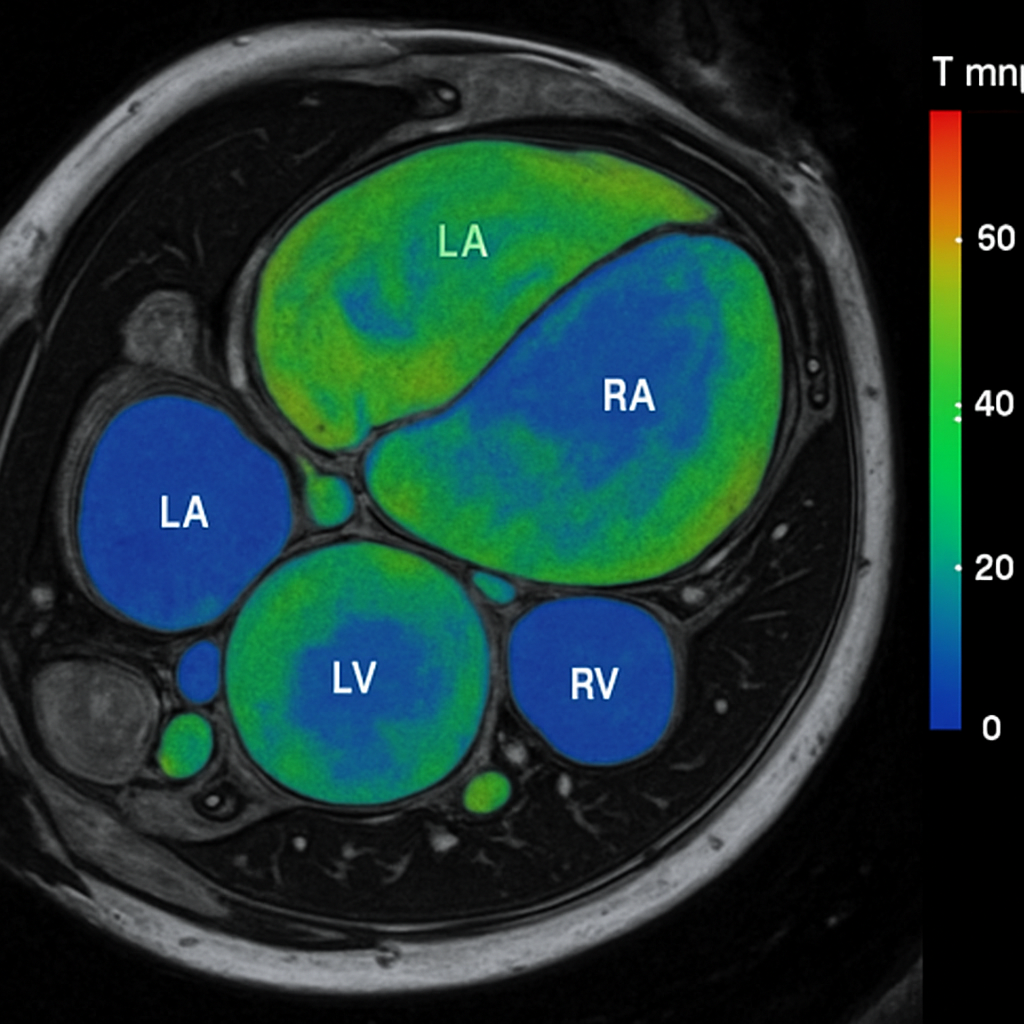
T2 mapping of the heart in short-axis view with color overlay showing myocardial T2 values. Color scale. Normal myocardial T2 ~40ms at 1.5T.
T2 map, short axis, color-coded. Normal T2 ~40ms at 1.5T.
OpenAI gpt-image-1
Late gadolinium enhancement (LGE) MRI in short-axis view. Normal myocardium appears dark (nulled). Shows the pattern used to detect fibrosis, scar, or infarction. No enhancement in normal phantom.
Inversion-recovery GRE, 10-15 min post gadolinium. Dark (nulled) myocardium = normal. Show technique with TI set to null normal myocardium.
OpenAI gpt-image-1
First-pass myocardial perfusion MRI in short-axis view during peak contrast enhancement. Homogeneous myocardial enhancement indicates normal perfusion.
Dynamic first-pass perfusion, short axis, during gadolinium bolus. Show contrast arriving in RV, then LV, then myocardial enhancement.
OpenAI gpt-image-1
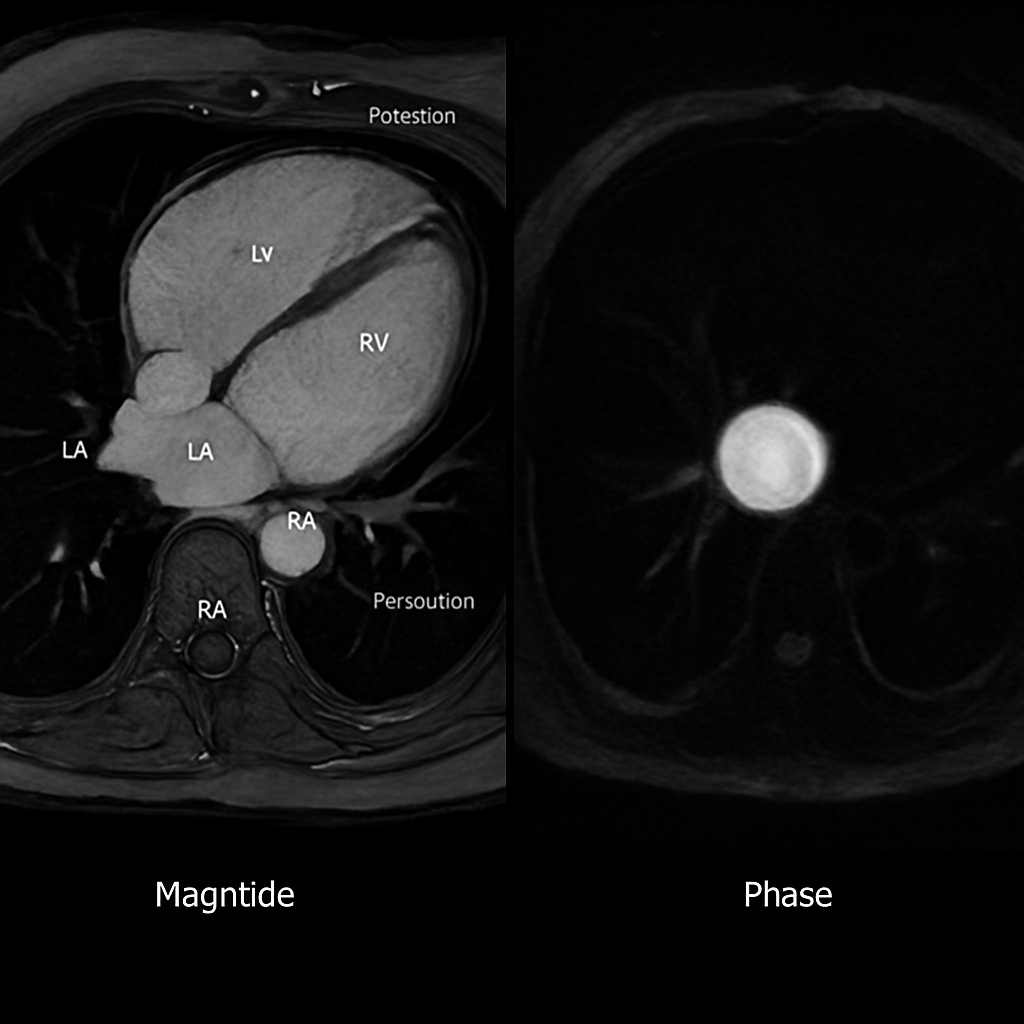
Phase-contrast velocity-encoded MRI through the aortic valve plane showing flow measurement. Magnitude and phase images. Used for stroke volume and regurgitation assessment.
2D phase-contrast flow through aortic valve. Show magnitude image (anatomy) and velocity map (bright = forward flow).
OpenAI gpt-image-1
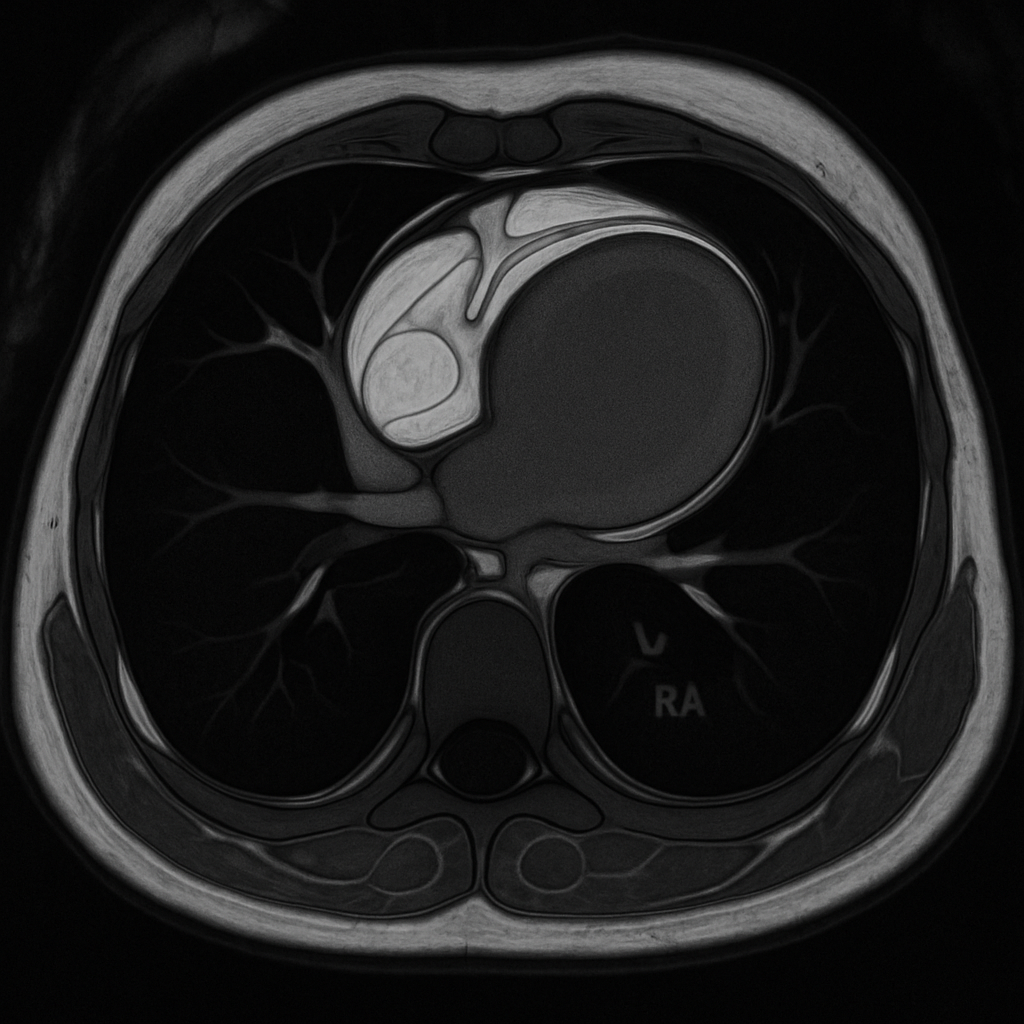
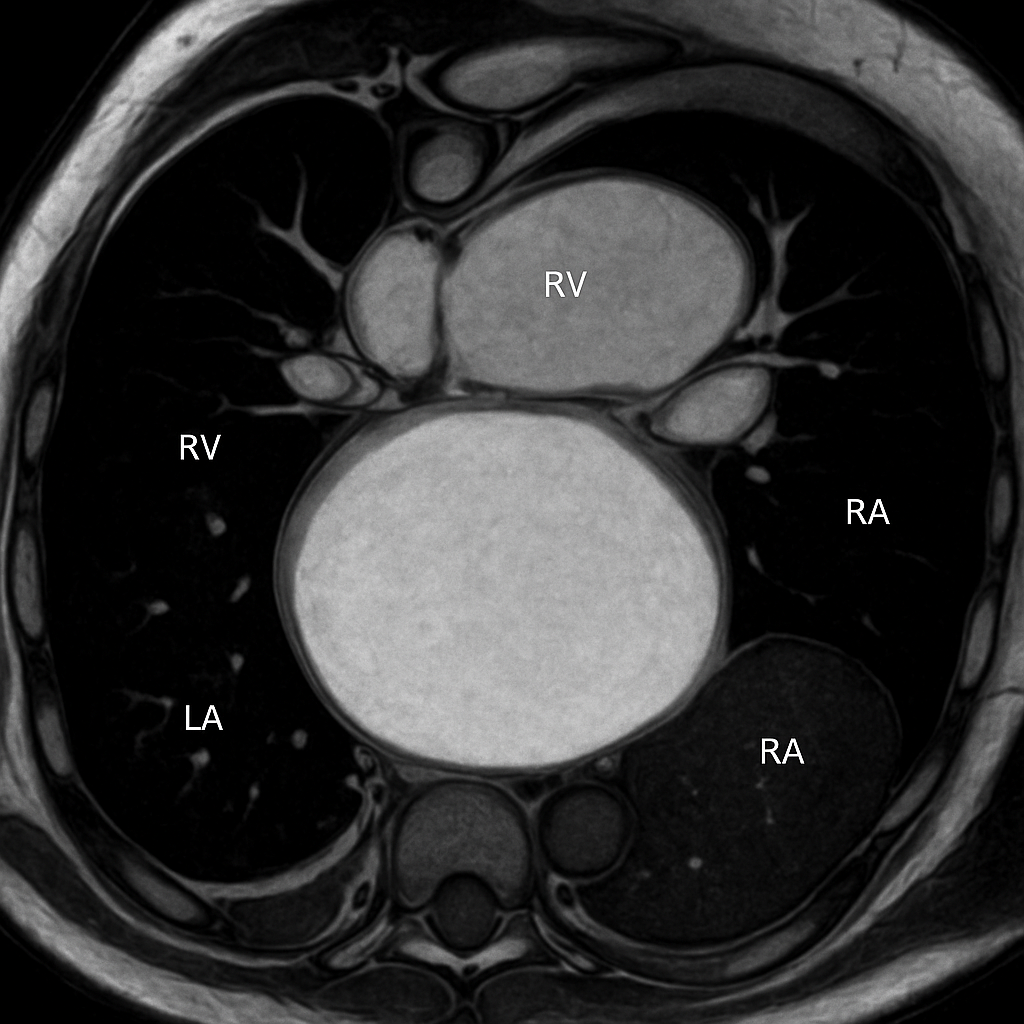
Dark-blood T1-weighted spin-echo cardiac MRI in short-axis view. Blood appears dark, myocardium is intermediate signal. Good for morphology and tissue characterization.
Double inversion recovery T1w spin echo. Dark blood pool, intermediate myocardium, bright pericardial fat.
OpenAI gpt-image-1
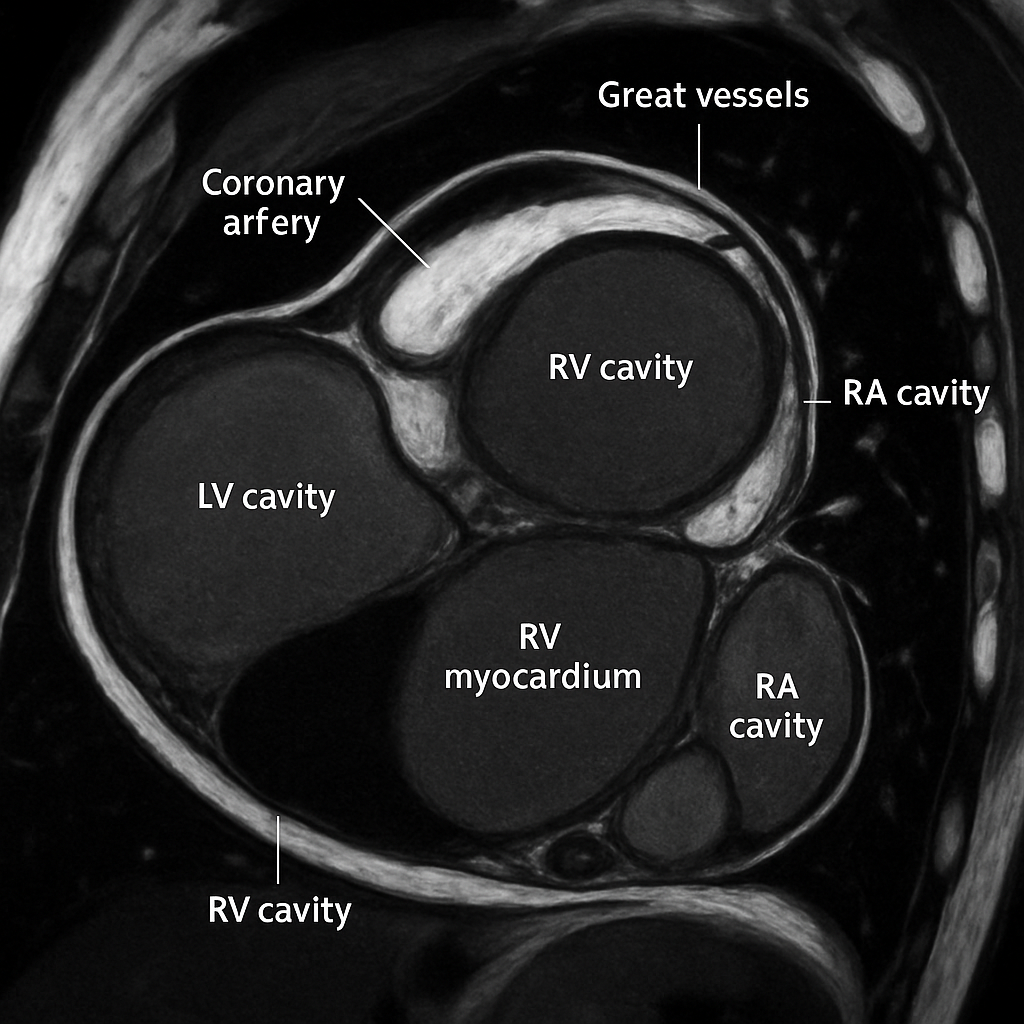
T2-weighted STIR (Short Tau Inversion Recovery) cardiac MRI in short-axis view for edema detection. Normal myocardium is intermediate signal. Edema would appear bright.
T2w STIR, short axis. Dark blood, intermediate normal myocardium, fat suppressed. Used for myocardial edema detection.
OpenAI gpt-image-1
Transthoracic echocardiogram parasternal long-axis (PLAX) view showing the aortic root, aortic valve, left atrium, mitral valve, left ventricle, interventricular septum, and RV.
2D B-mode TTE, PLAX view. Standard sector-shaped ultrasound with grey-scale tissue. Show depth markers and ECG trace at bottom.
OpenAI gpt-image-1
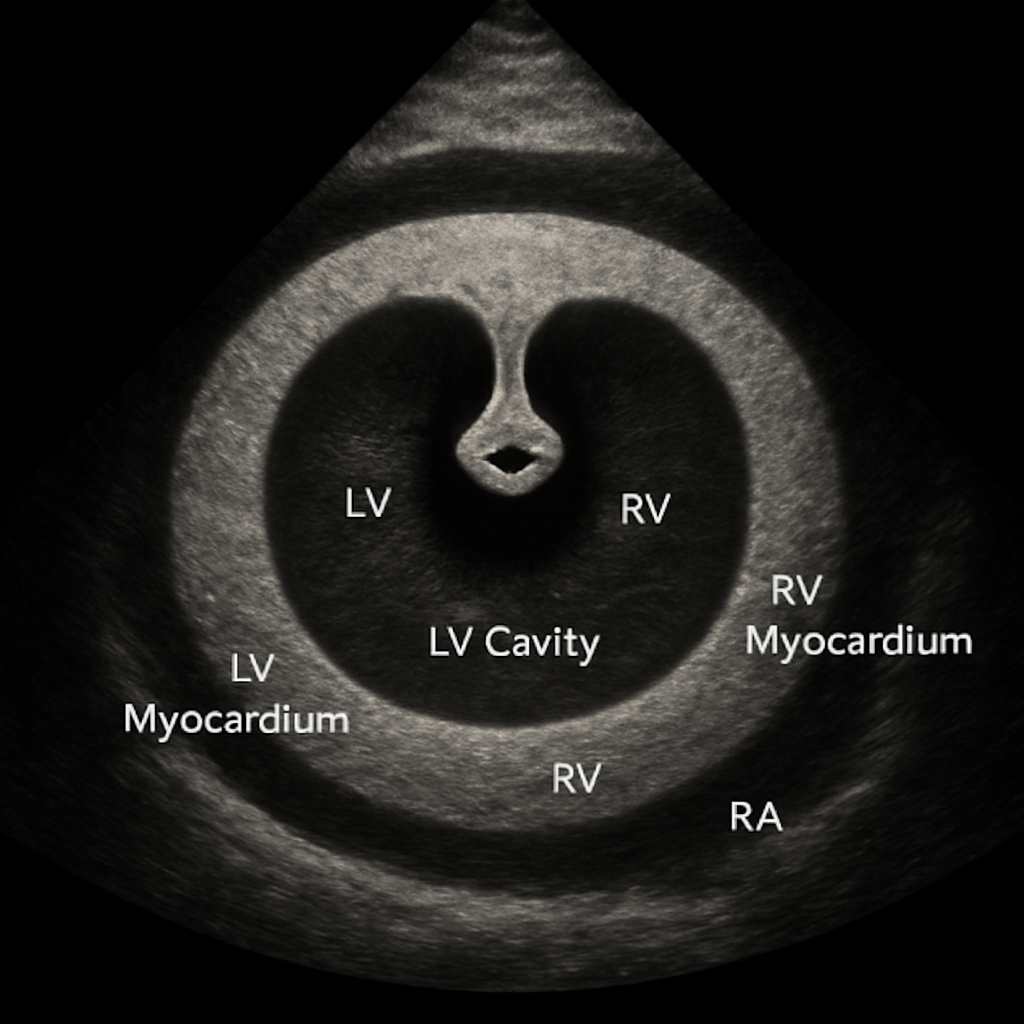
Transthoracic echocardiogram parasternal short-axis (PSAX) view at the mitral valve level showing the fish-mouth appearance of the mitral valve, circular LV, and RV.
2D B-mode TTE, PSAX at mitral valve level. Fish-mouth MV opening in circular LV cross-section.
OpenAI gpt-image-1
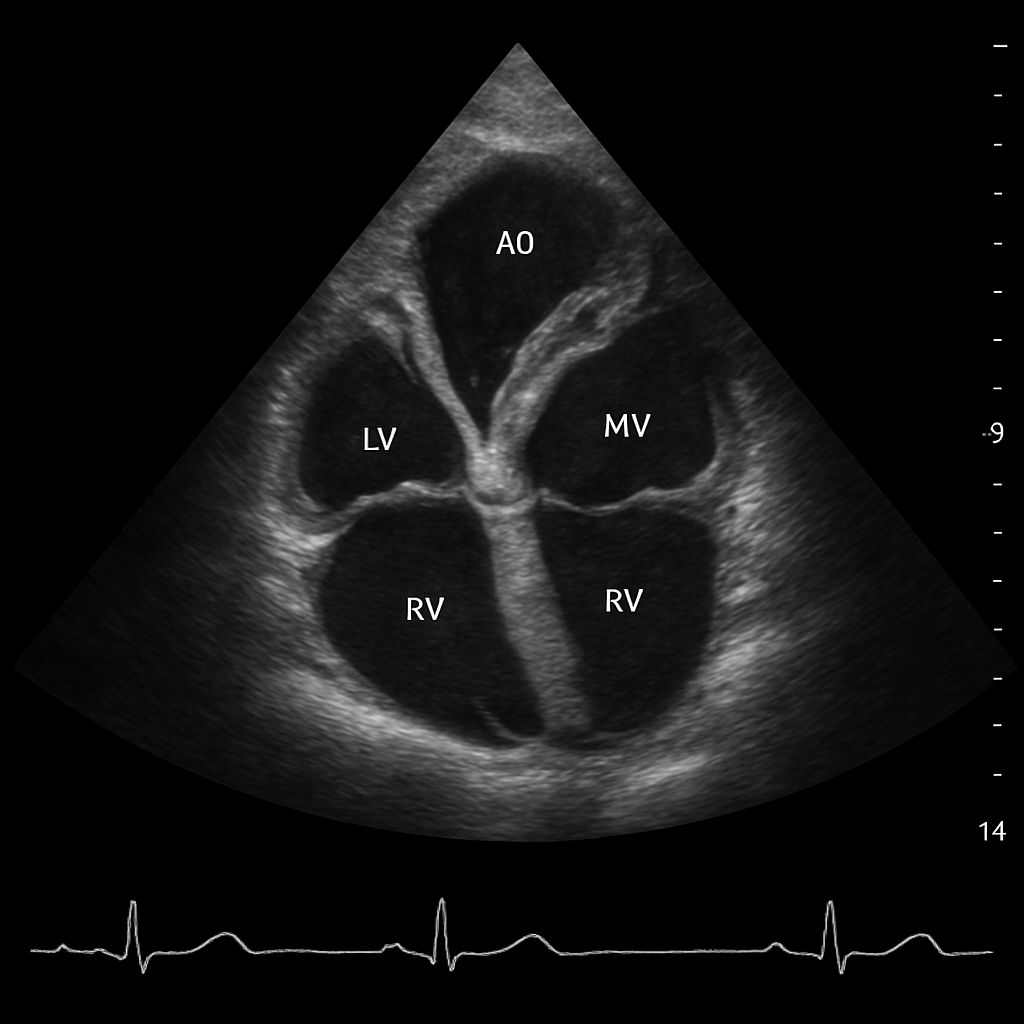
Transthoracic echocardiogram apical four-chamber (A4C) view showing all four cardiac chambers, mitral and tricuspid valves, and interatrial and interventricular septa.
2D B-mode TTE, apical 4-chamber. Apex at top of sector. All four chambers visible. ECG trace at bottom.
OpenAI gpt-image-1
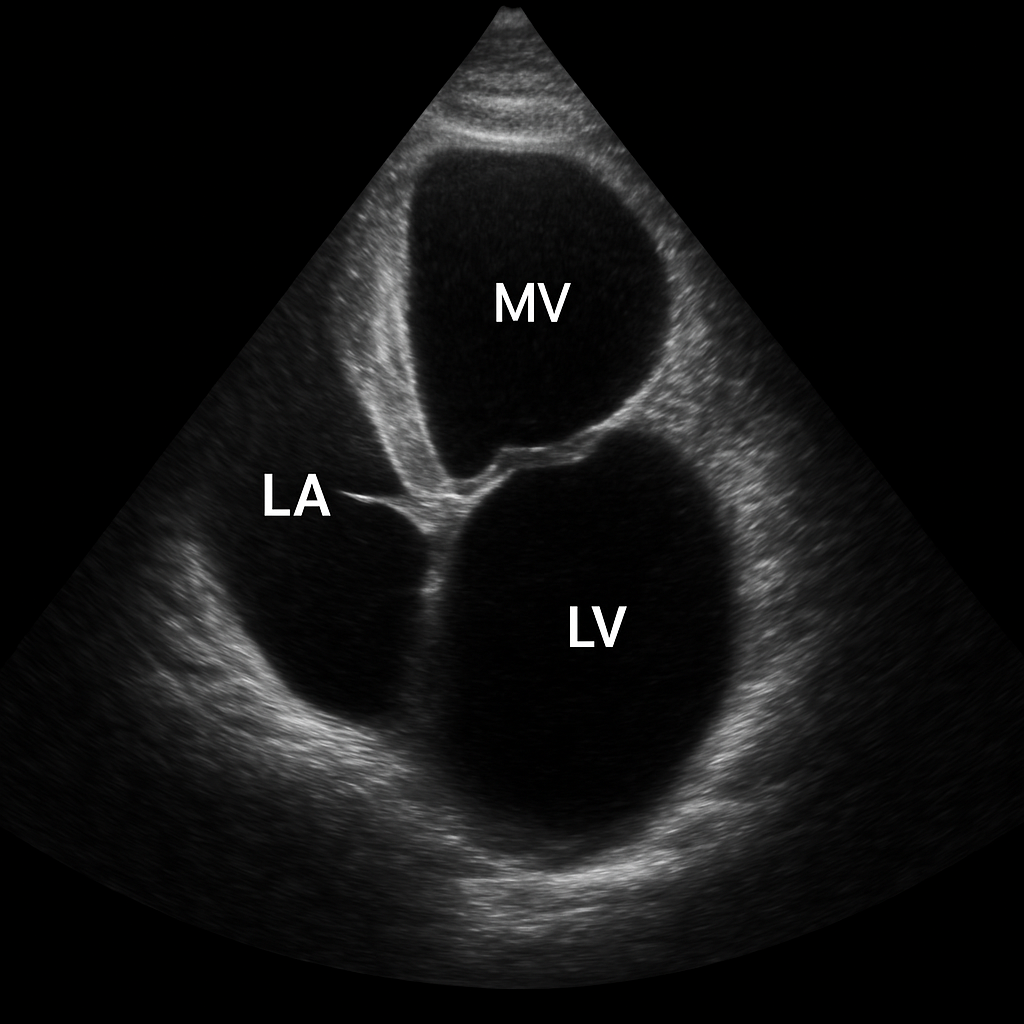
Transthoracic echocardiogram apical two-chamber (A2C) view showing the left atrium, mitral valve, and left ventricle with anterior and inferior walls.
2D B-mode TTE, apical 2-chamber. Show LA, MV, LV anterior and inferior walls.
OpenAI gpt-image-1
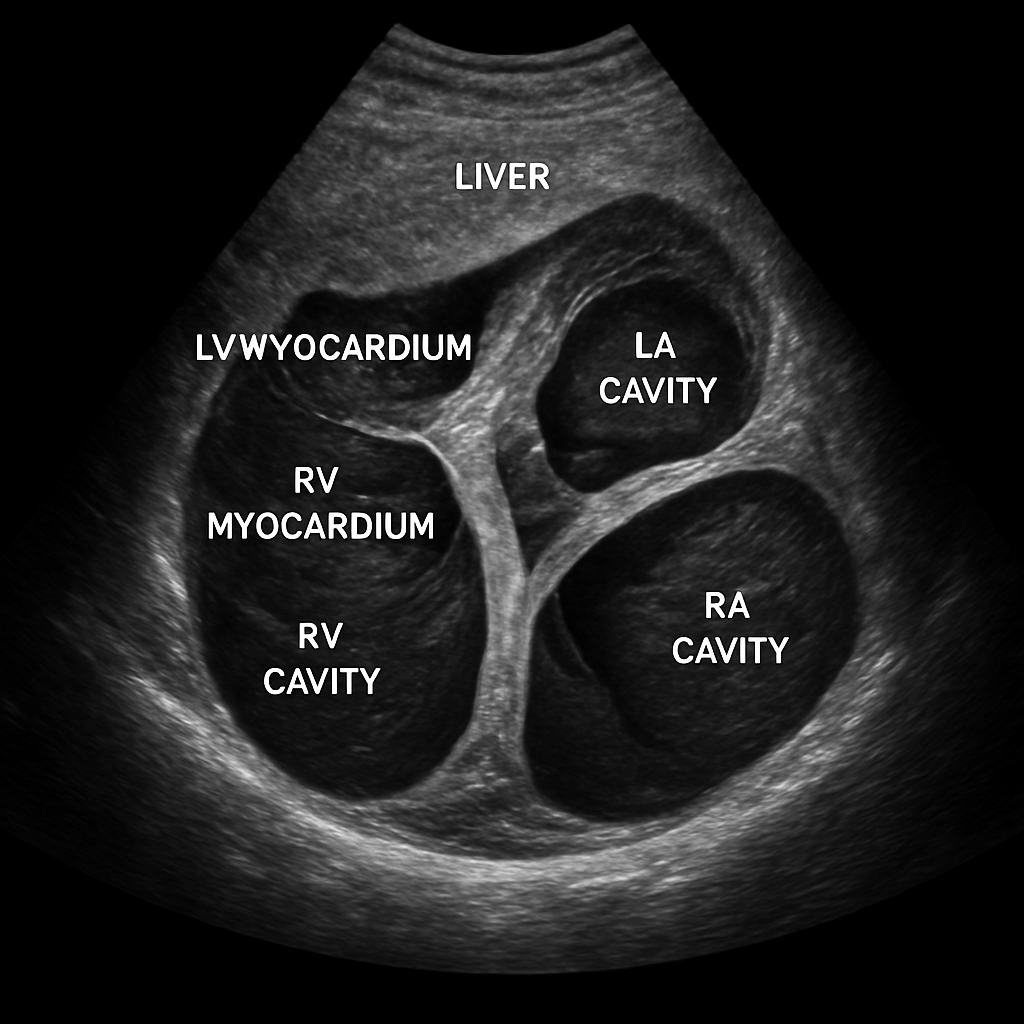
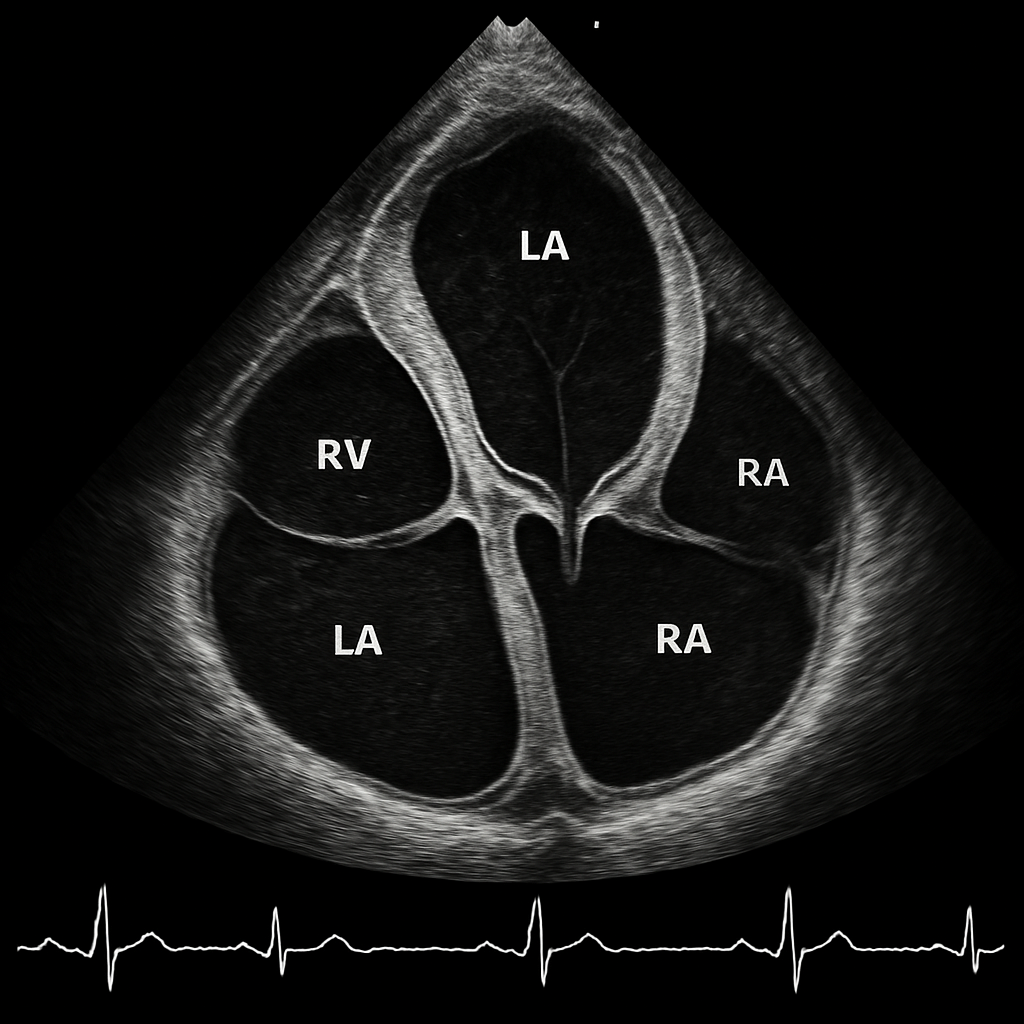
Transthoracic echocardiogram subcostal four-chamber view showing all chambers from a subxiphoid approach. Liver visible at top of image.
2D B-mode TTE, subcostal 4C view. Liver at near field, then heart with all four chambers.
OpenAI gpt-image-1
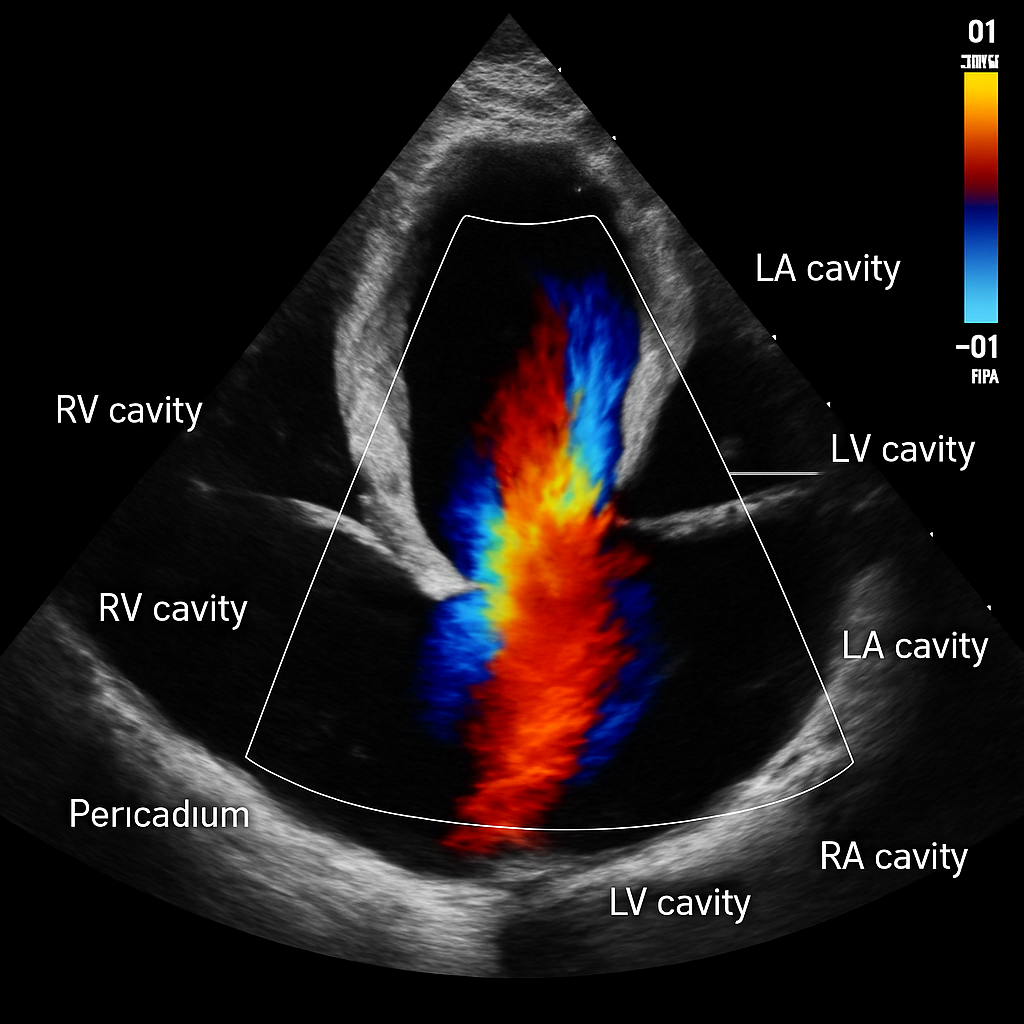
Color Doppler echocardiogram showing blood flow through the mitral valve in apical four-chamber view. Red-blue color map showing laminar diastolic inflow.
Color Doppler overlay on A4C view. Red = flow toward transducer (mitral inflow). Show color velocity scale bar.
OpenAI gpt-image-1
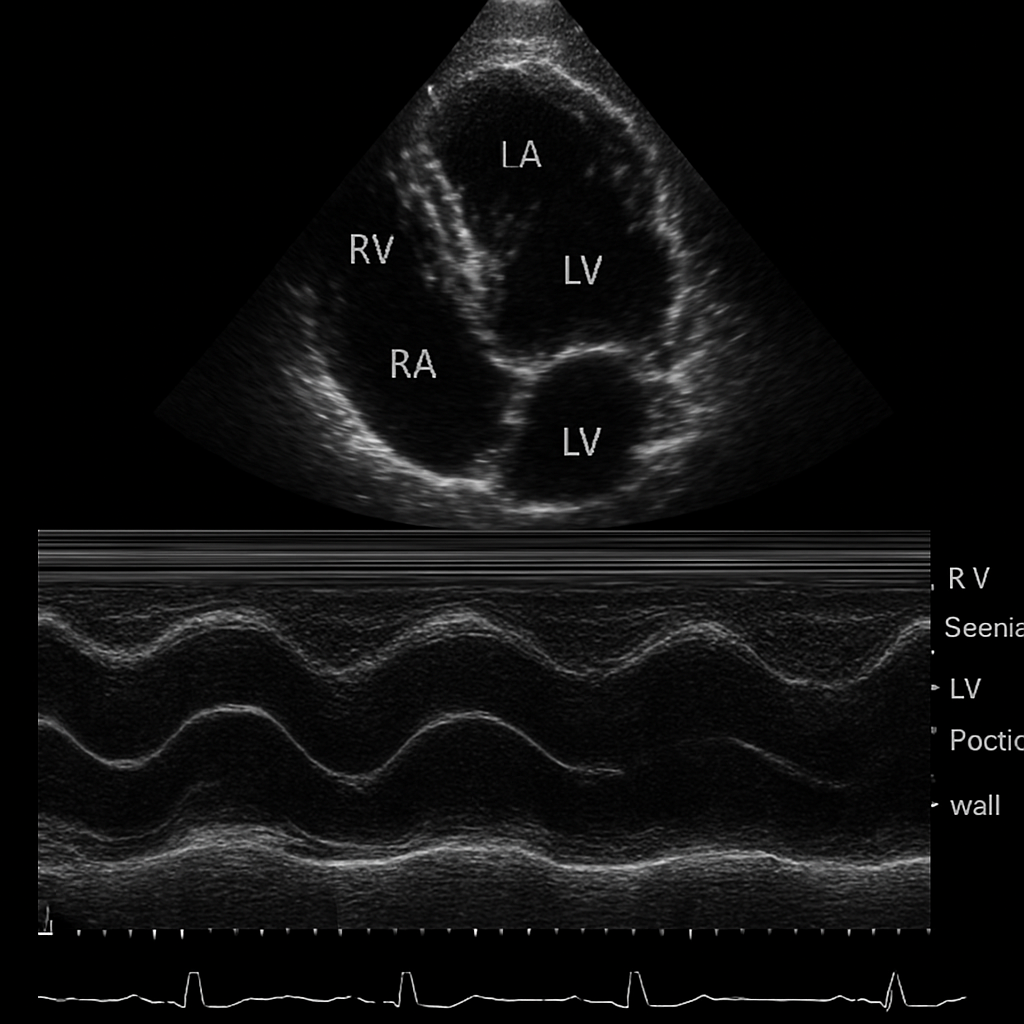
M-mode echocardiogram from parasternal view showing motion of cardiac structures over time. Includes RV wall, septum, LV cavity, and posterior wall. Time on horizontal axis.
M-mode trace from PLAX position. Show sinusoidal motion of septum and posterior wall. Time-motion display. ECG trace at bottom.
OpenAI gpt-image-1
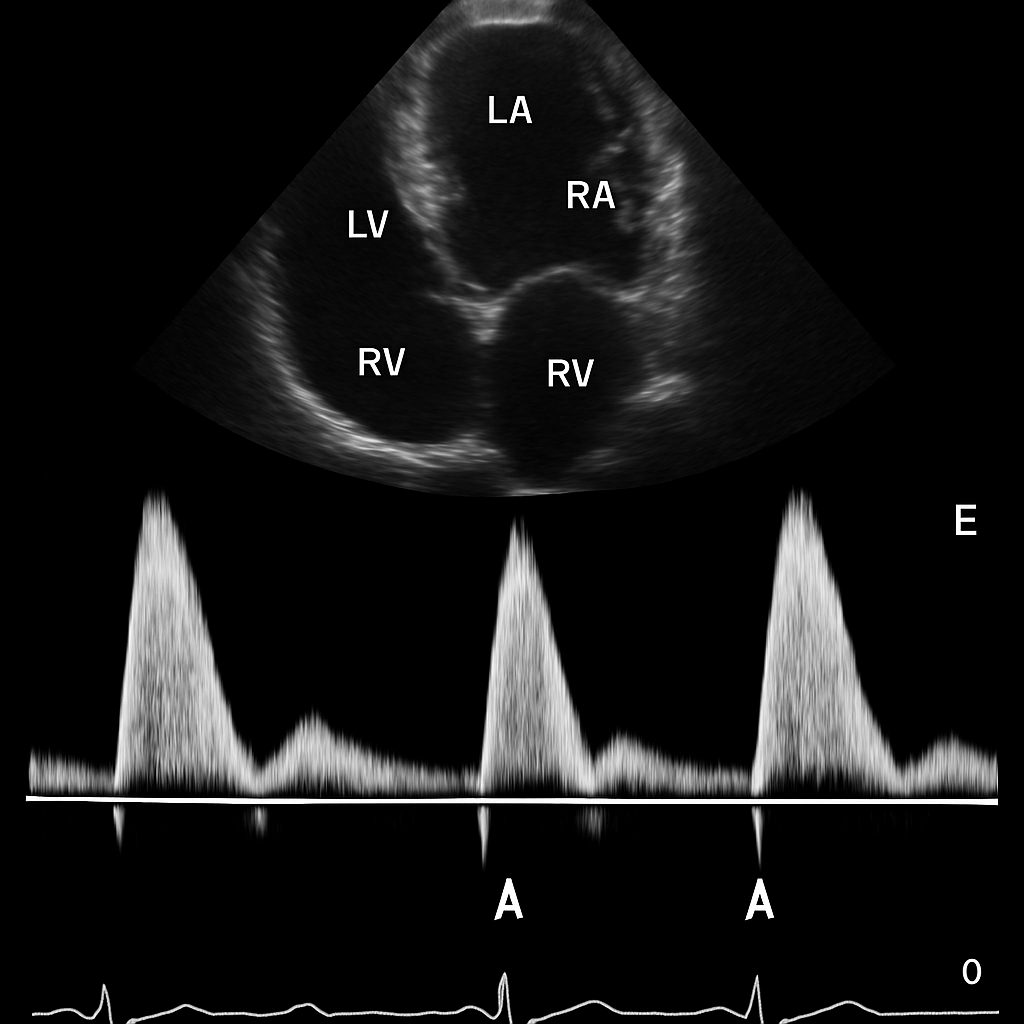
Pulsed-wave Doppler spectral display of mitral valve inflow showing E and A waves. Normal E/A ratio. ECG trace at bottom.
PW Doppler at mitral valve tips. Show E wave and A wave below baseline. Velocity scale on side. ECG at bottom.
OpenAI gpt-image-1
Tc-99m sestamibi SPECT myocardial perfusion imaging in short-axis view. Uniform tracer uptake in a horseshoe-shaped LV myocardium (apical-to-basal slices). Color scale from black to bright.
Myocardial perfusion SPECT, Tc-99m sestamibi, stress images. Short axis slices arranged apical→basal. Homogeneous uptake = normal. Hot color scale.
OpenAI gpt-image-1
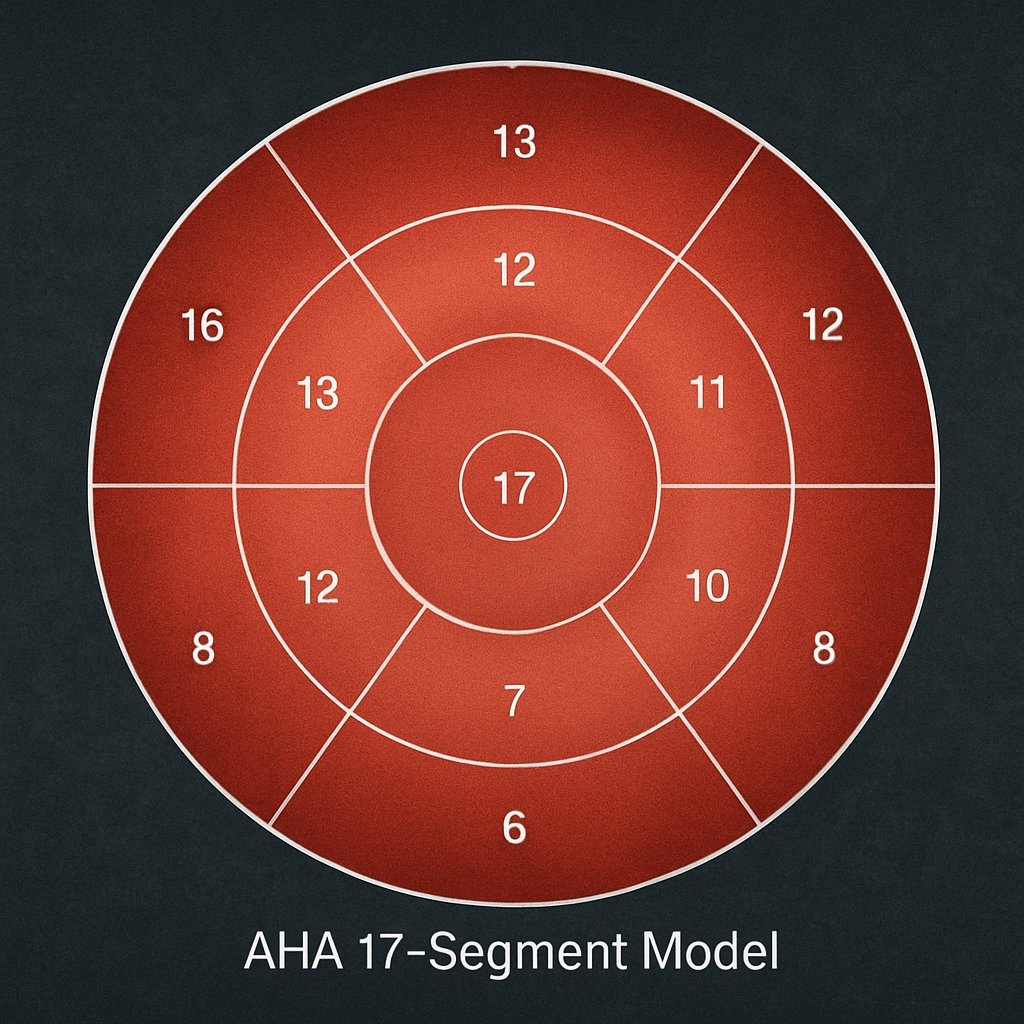
Polar bull's-eye map of myocardial perfusion from SPECT showing the 17-segment model. Uniform tracer distribution across all segments. AHA 17-segment overlay.
Polar (bull's-eye) map of myocardial perfusion. 17-segment model. Central = apex, outer ring = base. Uniform color = normal perfusion.
OpenAI gpt-image-1
SPECT myocardial perfusion in vertical long-axis view showing anterior and inferior walls from apex to base. Normal uniform tracer uptake.
Myocardial perfusion SPECT, vertical long-axis slices. Show anterior and inferior walls. Nuclear medicine color scale.
OpenAI gpt-image-1
FDG-PET scan of the heart showing myocardial glucose metabolism. Short-axis view with homogeneous FDG uptake indicating viable myocardium. Hot color scale.
FDG-PET viability study, short axis. Uniform FDG uptake = viable myocardium. Hot color scale (black-red-yellow-white).
OpenAI gpt-image-1
Rb-82 PET myocardial perfusion imaging in short-axis view showing quantitative perfusion. High-resolution short-axis slices with uniform tracer uptake.
Rb-82 PET perfusion, short axis. Superior resolution vs SPECT. Quantitative myocardial blood flow. Hot color scale.
OpenAI gpt-image-1
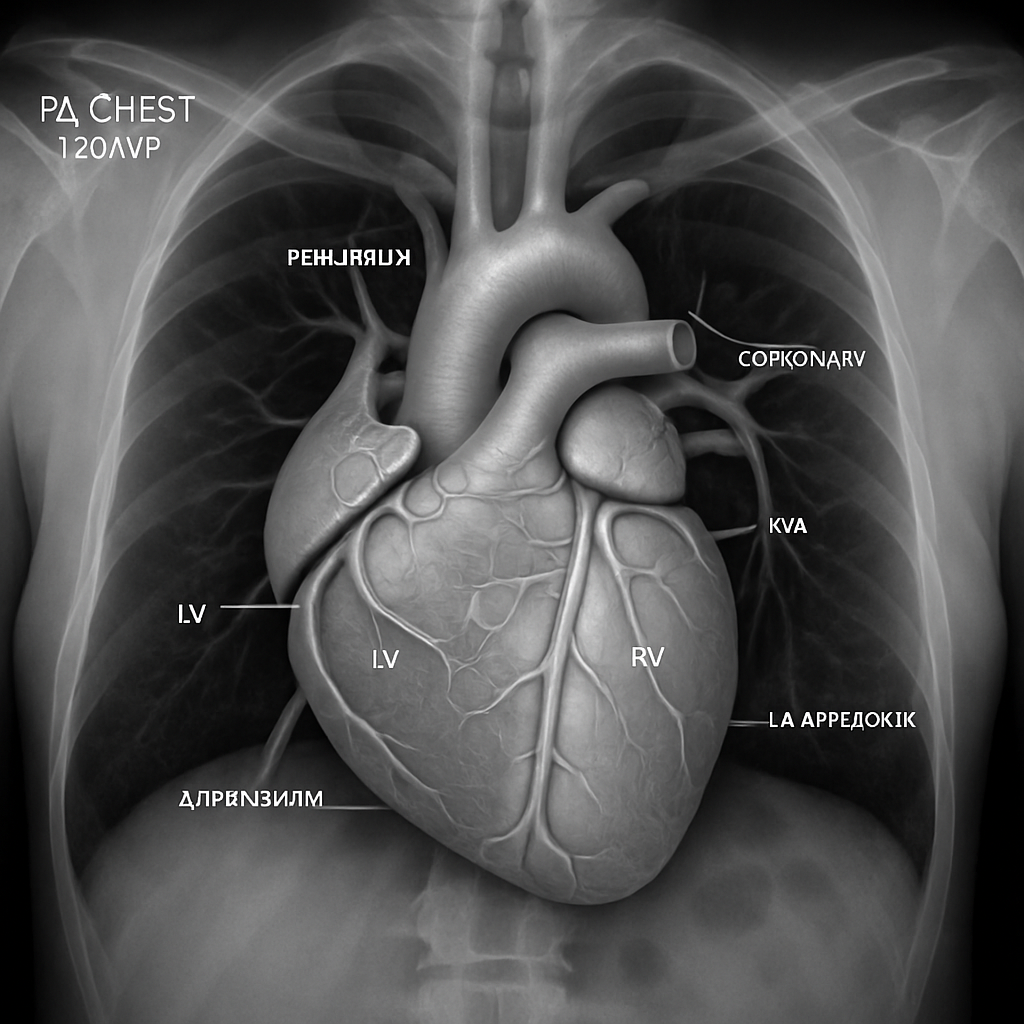
PA chest radiograph focused on the cardiac silhouette showing the normal heart borders. Normal cardiothoracic ratio. Visible structures: right atrial border, left ventricular border, aortic knob, pulmonary artery segment.
Standard PA chest X-ray focused on cardiac silhouette. Normal CTR <0.5. Show aortic knob, PA segment, LA appendage, LV border.
OpenAI gpt-image-1
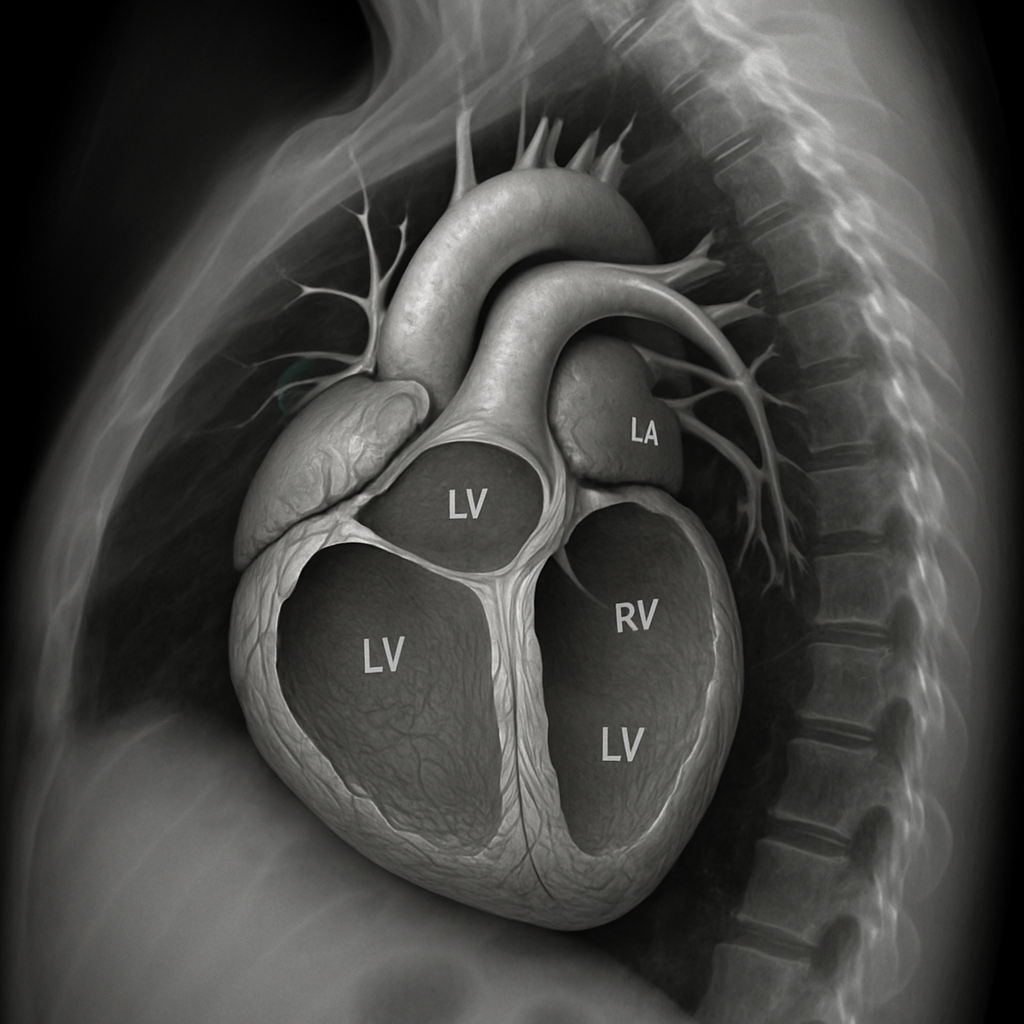
Lateral chest radiograph showing the heart in profile. Retrosternal clear space, posterior cardiac border (LA and LV), and aortic arch visible.
Lateral chest X-ray. Show retrosternal clear space (RV), posterior cardiac border (LA above, LV below). Aortic arch visible.
OpenAI gpt-image-1
Tissue Structures
| Structure | Density (HU) | T1 (ms) | T2 (ms) | Echo | Rel. Size | |
|---|---|---|---|---|---|---|
| Lv Myocardium | 50 | 1030 | 40 | 0.55 | 14% | |
| Rv Myocardium | 48 | 1050 | 42 | 0.5 | 6% | |
| Lv Cavity | 40 | 1500 | 250 | 0.05 | 10% | |
| Rv Cavity | 40 | 1500 | 250 | 0.05 | 7% | |
| La Cavity | 40 | 1500 | 250 | 0.05 | 4% | |
| Ra Cavity | 40 | 1500 | 250 | 0.05 | 4% | |
| Interventricular Septum | 55 | 1000 | 38 | 0.6 | 5% | |
| Interatrial Septum | 52 | 1020 | 39 | 0.55 | 2% | |
| Mitral Valve | 60 | 900 | 30 | 0.7 | 1% | |
| Aortic Valve | 65 | 880 | 28 | 0.75 | 1% | |
| Tricuspid Valve | 58 | 910 | 31 | 0.68 | 1% | |
| Pulmonary Valve | 62 | 890 | 29 | 0.72 | 1% | |
| Ascending Aorta | 45 | 1200 | 50 | 0.3 | 3% | |
| Aortic Arch | 45 | 1200 | 50 | 0.3 | 2% | |
| Pulmonary Artery | 42 | 1250 | 55 | 0.25 | 3% | |
| Coronary Lad | 250 | 1200 | 50 | 0.2 | 1% | |
| Coronary Lcx | 250 | 1200 | 50 | 0.2 | 1% | |
| Coronary Rca | 250 | 1200 | 50 | 0.2 | 1% | |
| Pericardium | 10 | 2000 | 100 | 0.7 | 3% | |
| Pericardial Fat | -100 | 250 | 80 | 0.6 | 5% | |
| Papillary Muscle | 52 | 1020 | 39 | 0.58 | 2% | |
| Svc | 42 | 1300 | 55 | 0.2 | 2% | |
| Ivc | 42 | 1300 | 55 | 0.2 | 2% | |
| Pulmonary Veins | 42 | 1250 | 52 | 0.2 | 2% |
Compatible Imaging Instruments
| Model | Manufacturer | Modality |
|---|---|---|
| Aquilion ONE PRISM | Canon Medical Systems | CT |
| Vantage Galan 3T | Canon Medical Systems | MRI |
| Aplio i900 | Canon Medical Systems | ULTRASOUND |
| SCENARIA View | Fujifilm Healthcare | CT |
| Arietta 850 DeepInsight | Fujifilm Healthcare | ULTRASOUND |
| Revolution Apex | GE HealthCare | CT |
| SIGNA Hero | GE HealthCare | MRI |
| SIGNA Premier | GE HealthCare | MRI |
| Discovery MI Gen 2 | GE HealthCare | PET |
| Voluson Expert 22 | GE HealthCare | ULTRASOUND |
| Resona I9 | Mindray | ULTRASOUND |
| Spectral CT 7500 | Philips Healthcare | CT |
| Ingenia Ambition 1.5T | Philips Healthcare | MRI |
| EPIQ Elite | Philips Healthcare | ULTRASOUND |
| Vereos Digital PET/CT | Philips Healthcare | PET |
| SOMATOM Force | Siemens Healthineers | CT |
| MAGNETOM Vida | Siemens Healthineers | MRI |
| MAGNETOM Terra.X | Siemens Healthineers | MRI |
| Symbia Intevo Bold | Siemens Healthineers | SPECT |
Edit Image Metadata
AI Generate Image — AI Cardiac
Fill in the imaging criteria below. A prompt will be built and sent to OpenAI to generate a realistic medical image.