Adult Chest
Adult Chest
ThoraxStandard adult chest phantom with lungs, heart, mediastinum, and ribs
Image Library
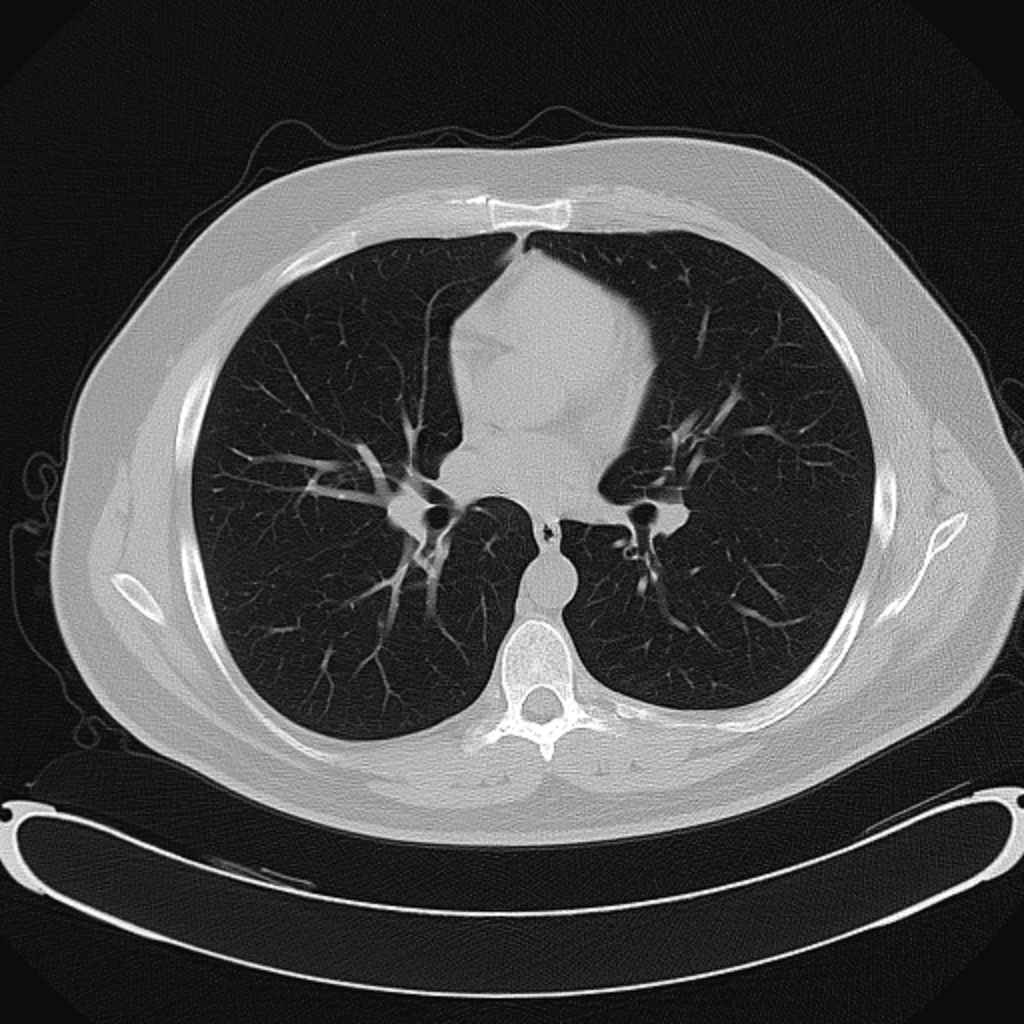
Axial CT slice through thorax with lung kernel (B70f), showing bilateral lung fields, airways, and pulmonary vasculature
Wikimedia Commons: CT-Thorax-5.0-B70f-Lungs.jpg
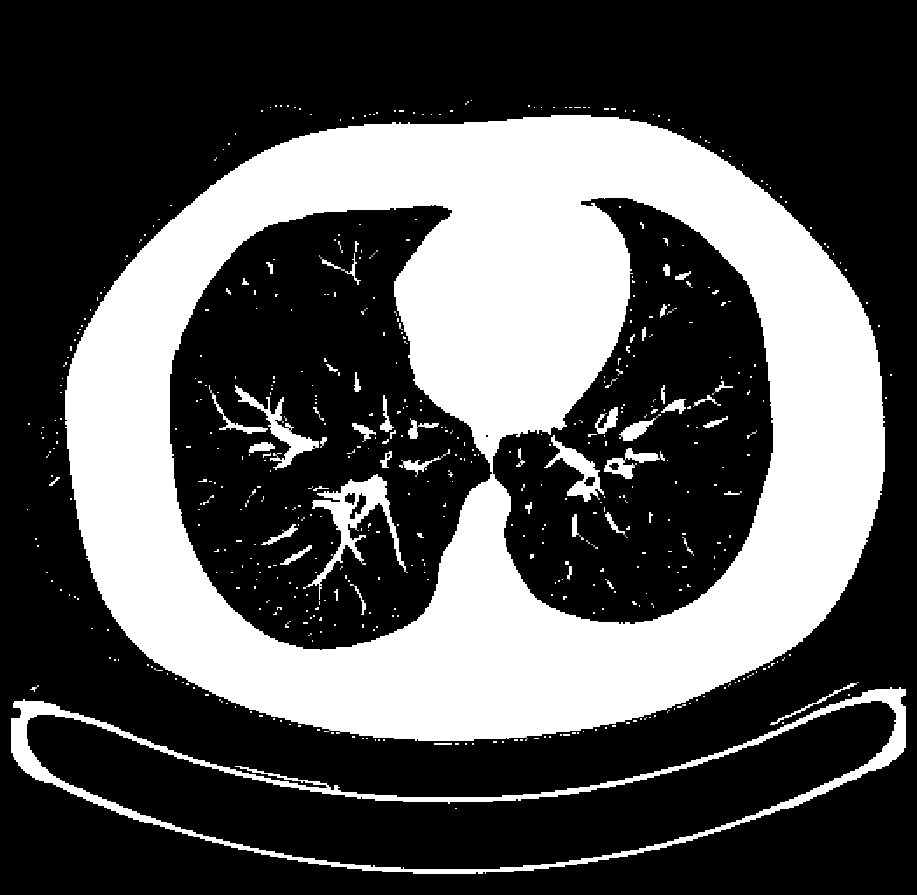
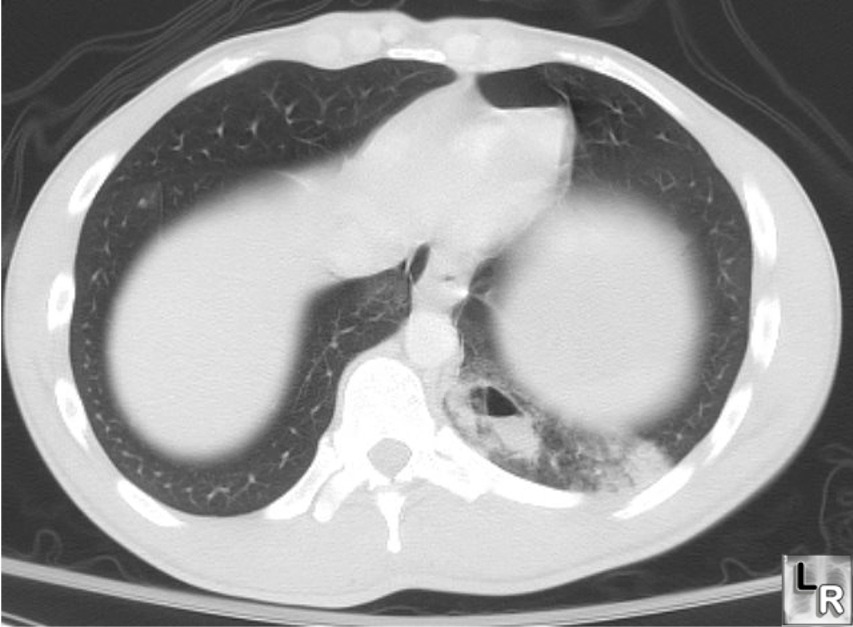
Axial CT of thorax displayed at -700 HU window level, optimized for lung parenchyma evaluation
Wikimedia Commons: CT Scan Thorax Lung -700 HU Window Level.jpg
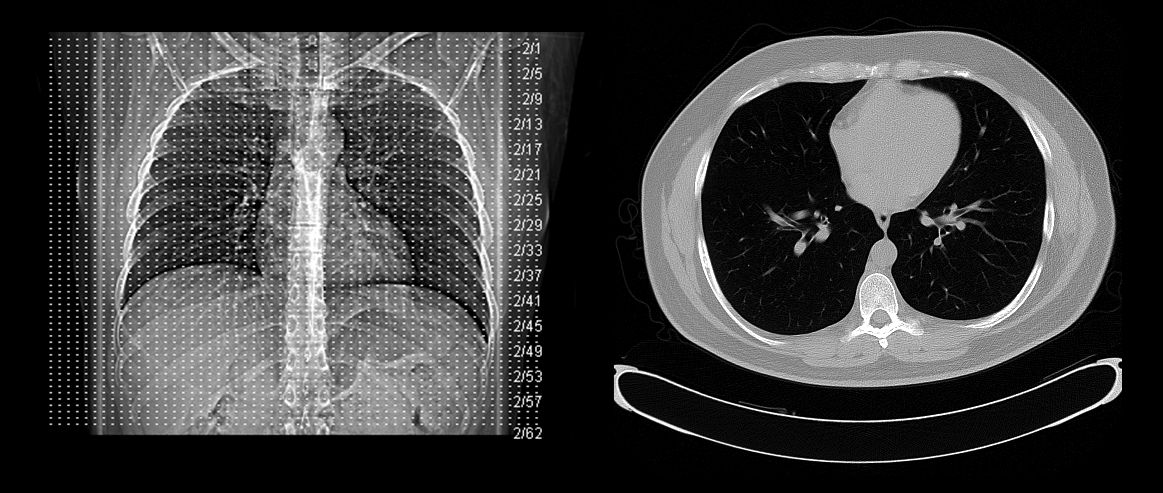
Illustrative axial CT of the thorax showing normal anatomy including heart, lungs, great vessels, and vertebral body
Wikimedia Commons: Axial plane CT scan of the thorax illustrative image.jpg
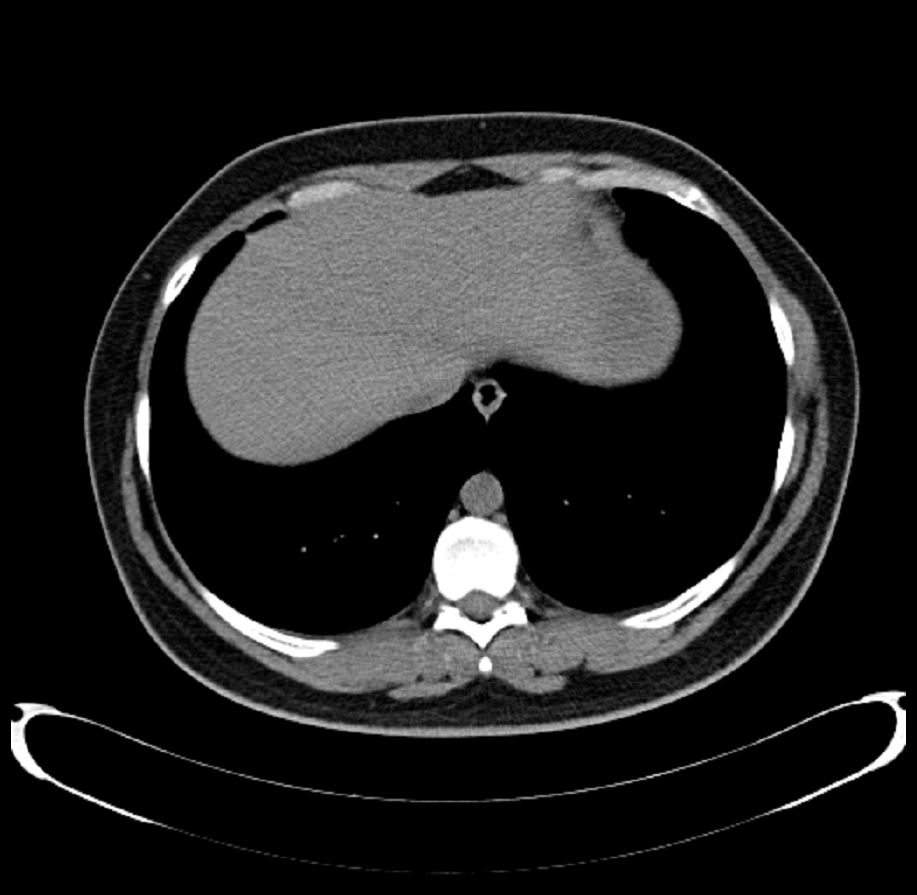
Axial CT at lower thorax level showing lung bases, liver dome, and lower mediastinum
Wikimedia Commons: CT Scan Thorax Liver.jpg
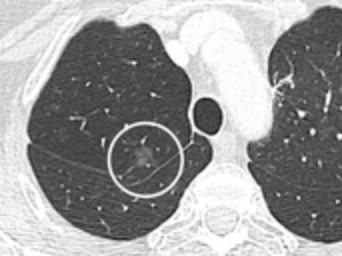
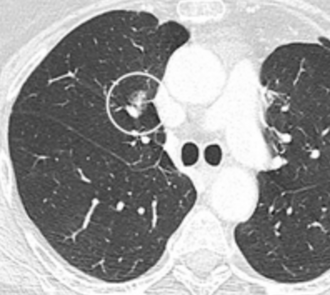
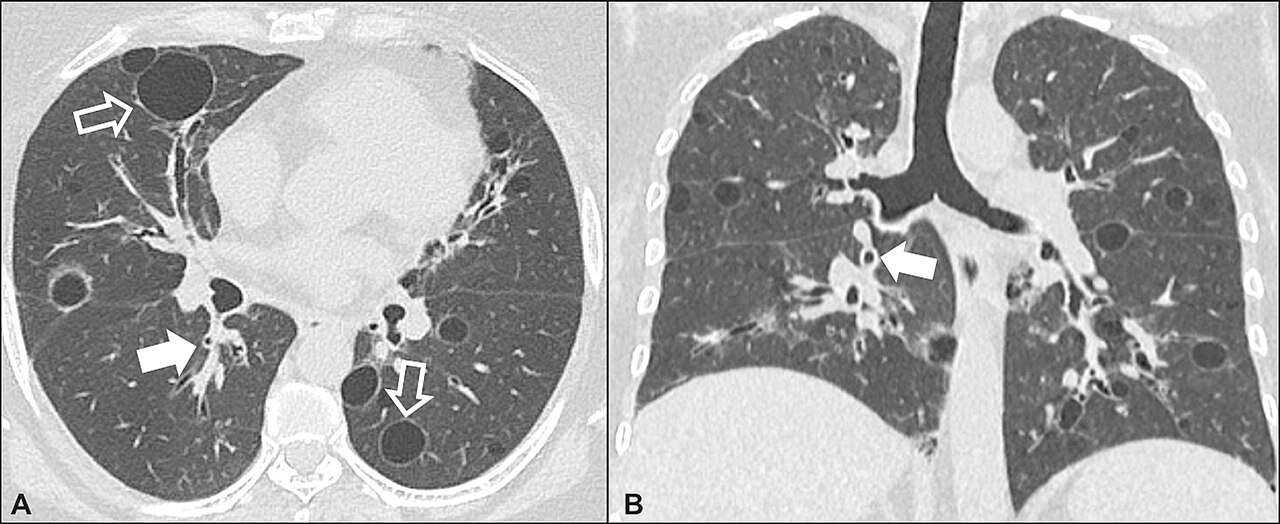
CT showing lung nodule with converging pulmonary vessels, a sign suggesting malignancy
Wikimedia Commons: CT of lung nodule with vascular convergence.png
CT showing a pure ground-glass opacity (GGO) nodule in the lung, often an early adenocarcinoma
Wikimedia Commons: CT of ground glass lung nodule.png
Chest CT showing bilateral hilar and mediastinal lymphadenopathy consistent with sarcoidosis
Wikimedia Commons: Sarcoidosis - Chest CT scan Case 242 (7609643866).jpg
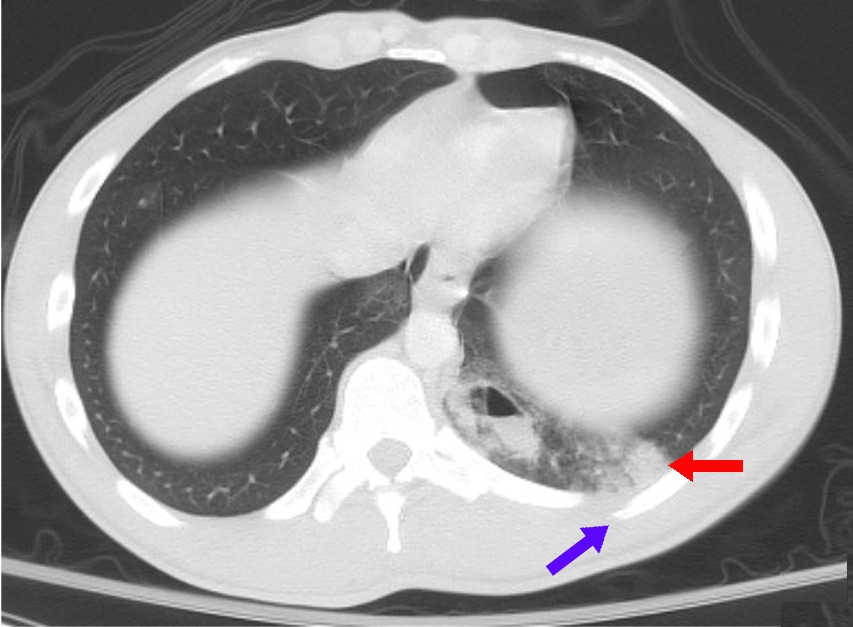
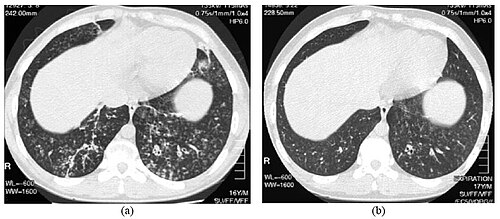
Axial CT showing pulmonary contusion with ground-glass opacification and consolidation following chest trauma
Wikimedia Commons: Pulmonary contusion CT arrow.jpg
CT showing bilateral pulmonary contusions with patchy areas of consolidation
Wikimedia Commons: Pulmonary contusion CT.jpg
CT showing a part-solid (mixed ground-glass and solid) pulmonary nodule, important finding in lung cancer screening
Wikimedia Commons: CT of part solid lung nodule.png
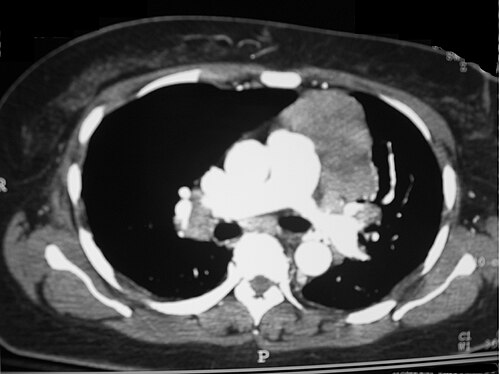
Axial CT showing a well-defined anterior mediastinal mass consistent with thymoma
Wikimedia Commons: Anterior mediastinal mass thymoma.jpg
CT angiography showing massive pulmonary embolism with complete occlusion of the pulmonary artery
Wikimedia Commons: CTA Chest With Massive Pulmonary Embolism and Complete Occlusion.jpg
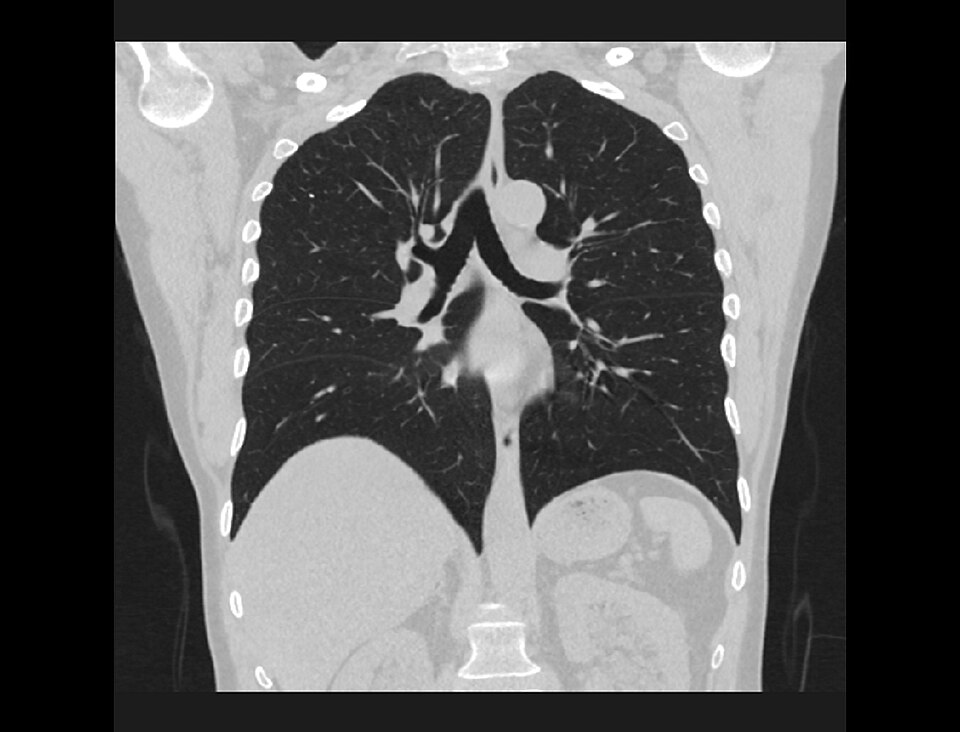
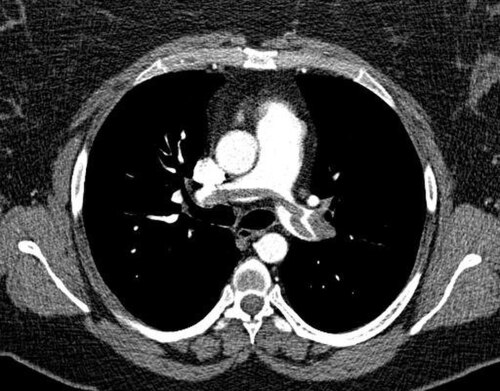
Coronal reformatted CT of the chest in lung window showing both lungs, airways, and diaphragm
Wikimedia Commons: COR-2-STND-CHEST-LUNGS.jpg
CT showing diffuse ground-glass opacity and cystic changes consistent with lymphocytic interstitial pneumonia (LIP)
Wikimedia Commons: CT of lymphocytic interstitial pneumonia.jpg

3D volume rendering of the tracheobronchial tree from CT data showing rupture injury
Wikimedia Commons: Tracheobronchial rupture 3D CT 3.jpg
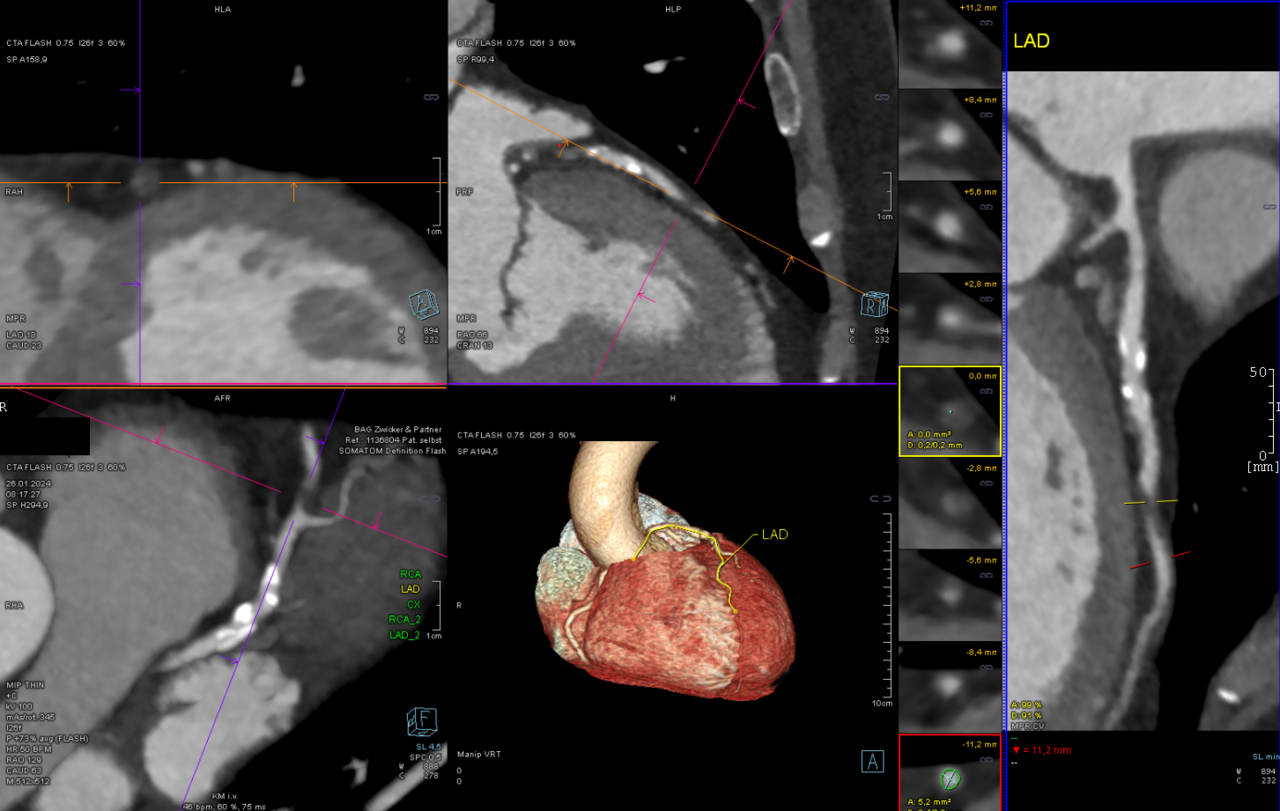
Coronary CT angiography showing the coronary arteries with volume rendering reconstruction
Wikimedia Commons: Ct-angiography.png
Coronary CT angiography showing severe stenosis (70-99%) graded CAD-RADS 4a
Wikimedia Commons: CCTA CAD-RADS 4a.png
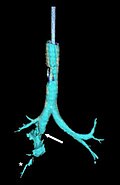
Another view of the 3D volume-rendered tracheobronchial tree showing the extent of injury
Wikimedia Commons: Tracheobronchial rupture 3D CT 2.jpg
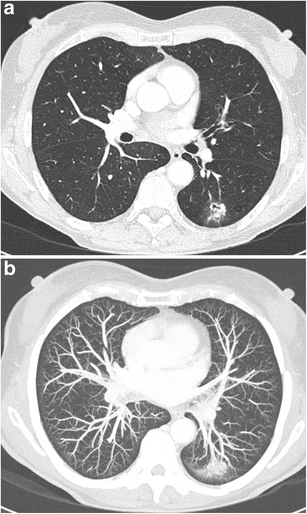
High-resolution CT (HRCT) showing tree-in-bud nodules and bronchiolectasis in diffuse panbronchiolitis
Wikimedia Commons: HRCT scans of diffuse panbronchiolitis.jpg
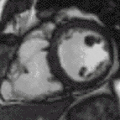
Cardiac MRI cine showing arrhythmogenic right ventricular cardiomyopathy (ARVC) with RV wall motion abnormalities
Wikimedia Commons: Cardiac magnetic resonance Arrhythmogenic right ventricular dysplasia.gif
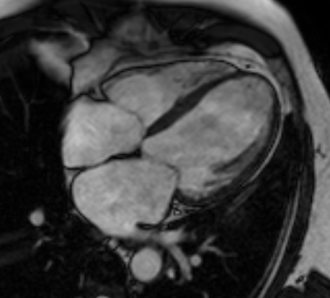
Four-chamber cardiac MRI cine showing myocardial infarction with wall motion abnormality
Wikimedia Commons: 4CH cine infarct.gif
MRI scan used for cancer staging showing thoracic anatomy and lesion characterization
Wikimedia Commons: Cancer MRI Scans (28750336678).jpg
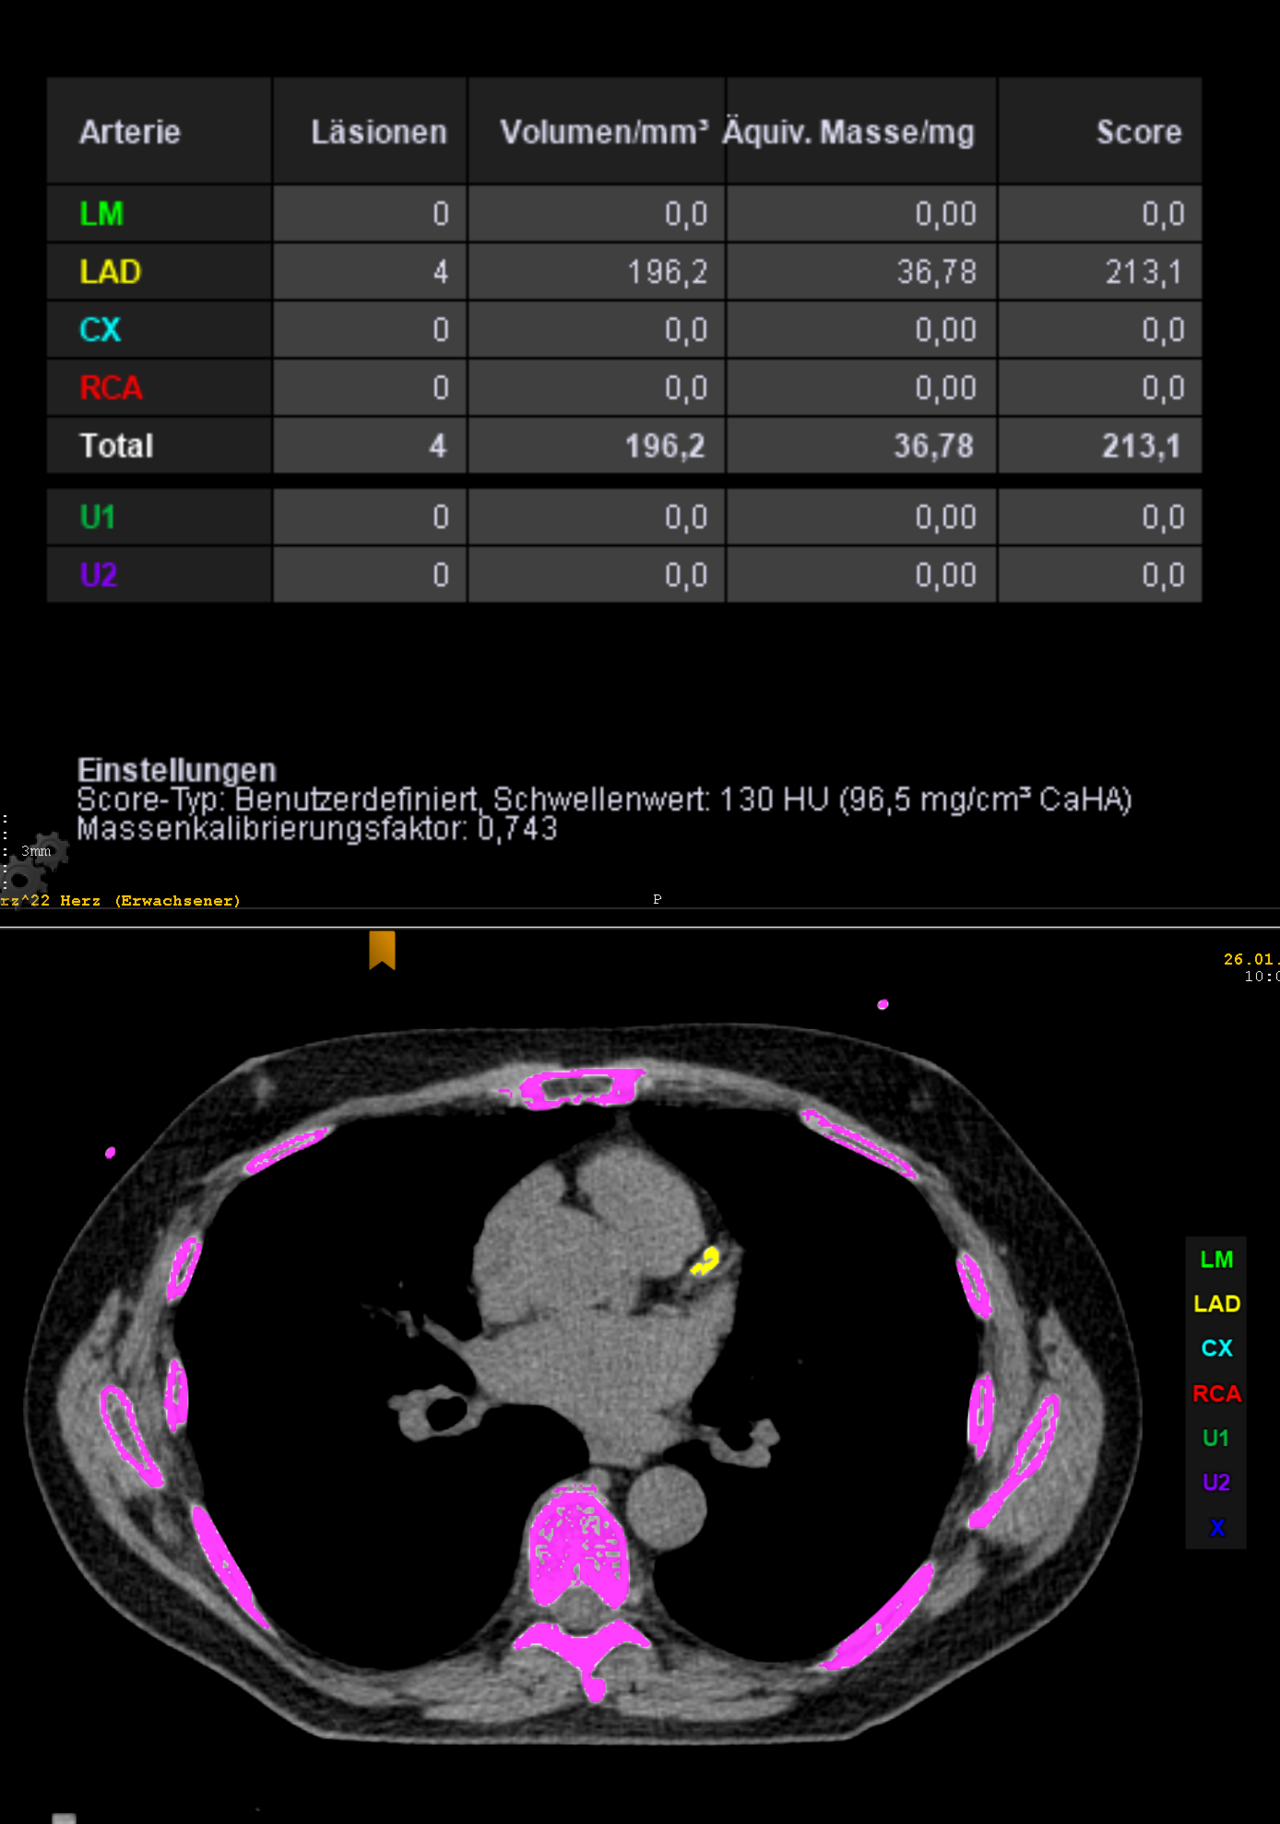
CT coronary calcium scoring (Agatston score) showing calcified coronary plaques
Wikimedia Commons: CCTA Agatston-Score.png
Sagittal CT reformation showing Morgagni hernia with bowel loops herniating through the anterior diaphragmatic defect
Wikimedia Commons: Morgagni Hernia.PNG
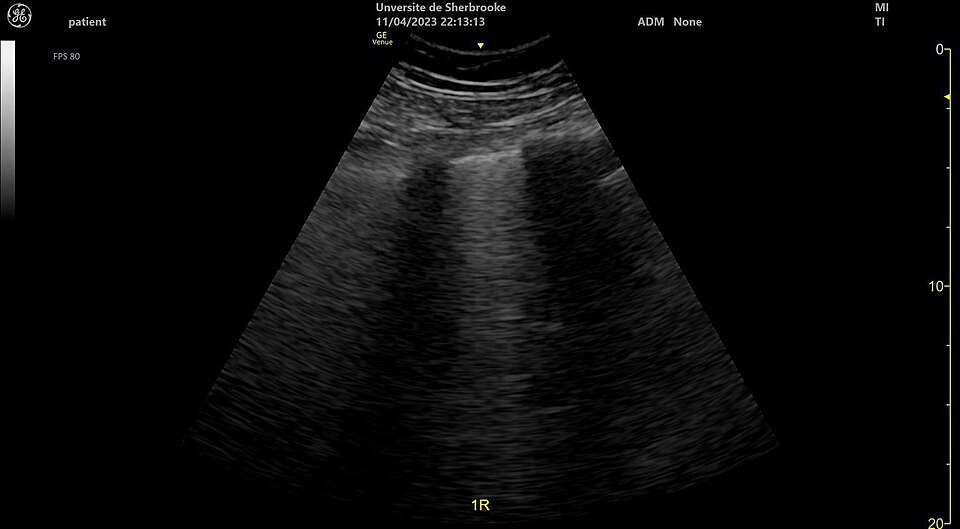
B-lines visible on lung ultrasound indicating interstitial disease in a patient with pulmonary fibrosis
Wikimedia Commons: B lines on a lung ultrasound of a patient with fibrosis.jpg
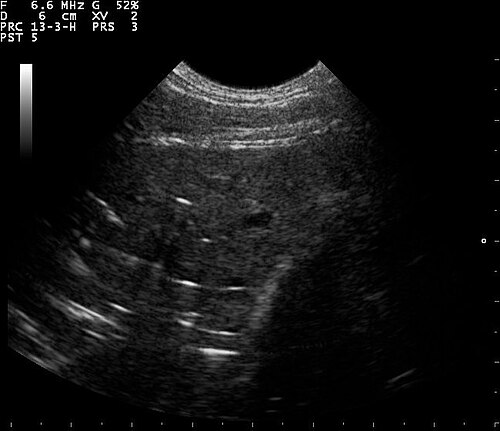
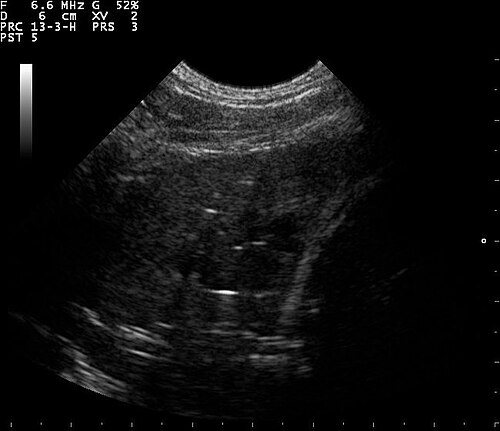
Ultrasound image showing wet lung appearance consistent with pulmonary edema
Wikimedia Commons: Ultrasound wet lung 110303143856 1451430.jpg
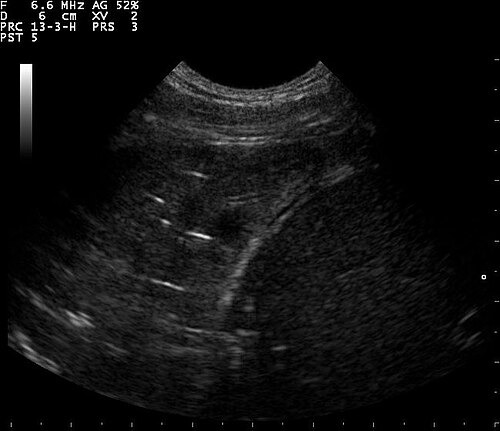
Lung ultrasound demonstrating fluid-filled interstitial spaces characteristic of pulmonary edema
Wikimedia Commons: Ultrasound wet lung 110303143856 1451580.jpg
Point-of-care lung ultrasound showing bilateral wet lung findings
Wikimedia Commons: Ultrasound wet lung 110303143856 1451050.jpg
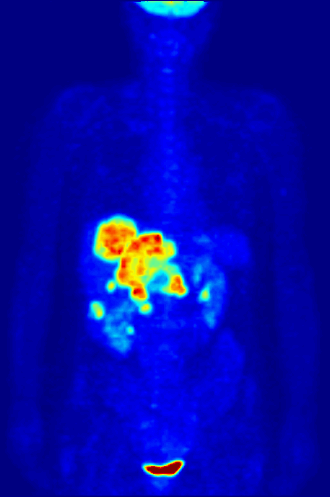
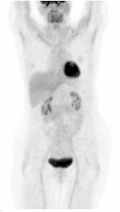
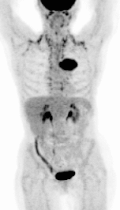
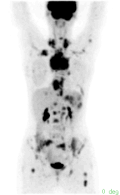
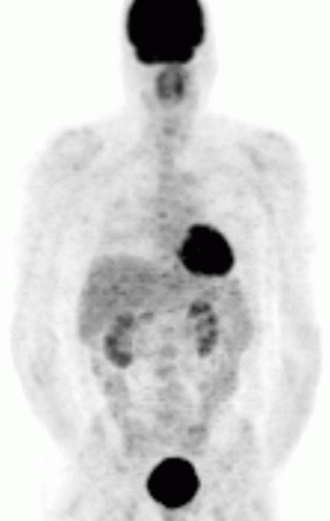
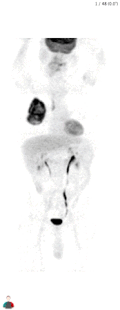
Rotating maximum intensity projection (MIP) of PET scan showing metabolic activity throughout thorax
Wikimedia Commons: PET-MIPS-anim.gif
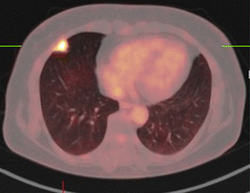
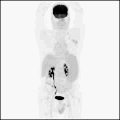
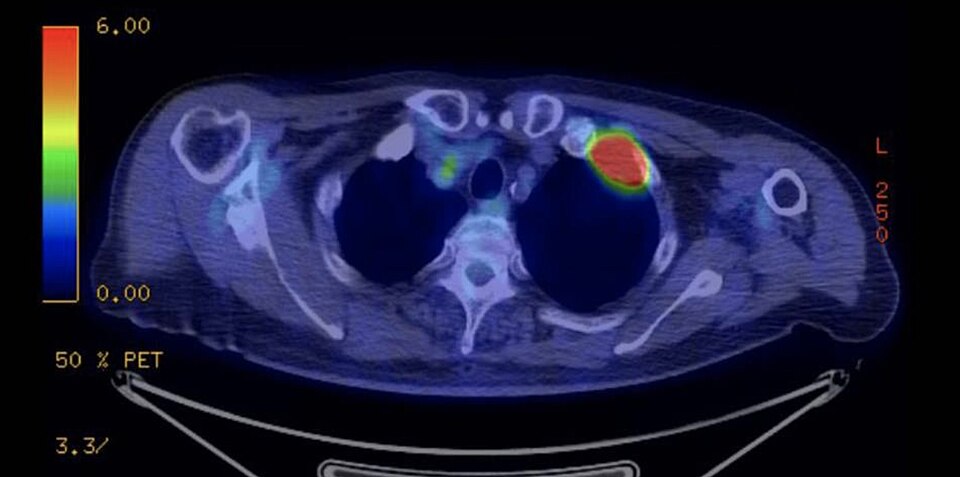
Combined PET/CT scan showing FDG-avid pulmonary tuberculoma in the chest
Wikimedia Commons: PET-CT of a tuberculoma.png
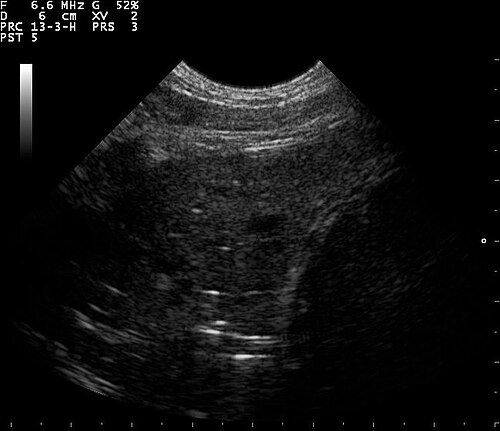
Additional ultrasound view of wet lung showing diffuse B-lines and pleural thickening
Wikimedia Commons: Ultrasound wet lung 110303143856 1451120.jpg
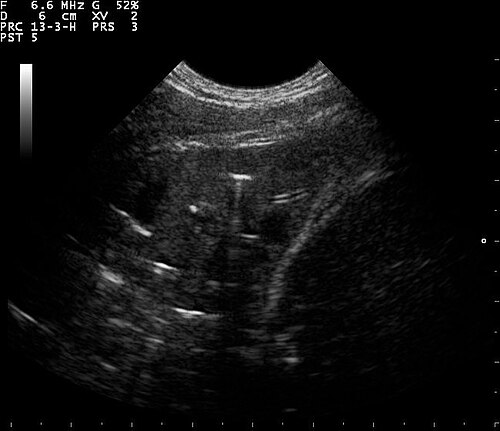
Ultrasound assessment of wet lung with comet tail artifacts
Wikimedia Commons: Ultrasound wet lung 110303143856 1451320.jpg
Axial PET scan slice showing FDG uptake in thoracic region
Wikimedia Commons: PET scan image 01.gif
Sequential axial PET scan slice demonstrating metabolic activity in chest structures
Wikimedia Commons: PET scan image 02.gif
PET scan demonstrating metabolic imaging of thoracic structures and mediastinum
Wikimedia Commons: PET scan image 04.gif
PET scan slice through the thorax showing normal and abnormal FDG uptake
Wikimedia Commons: PET scan image 06.gif
PET imaging showing FDG accumulation patterns in the thorax
Wikimedia Commons: PET scan image 03.gif
FDG-PET axial slice showing metabolic activity in chest region
Wikimedia Commons: PET scan image 05.gif
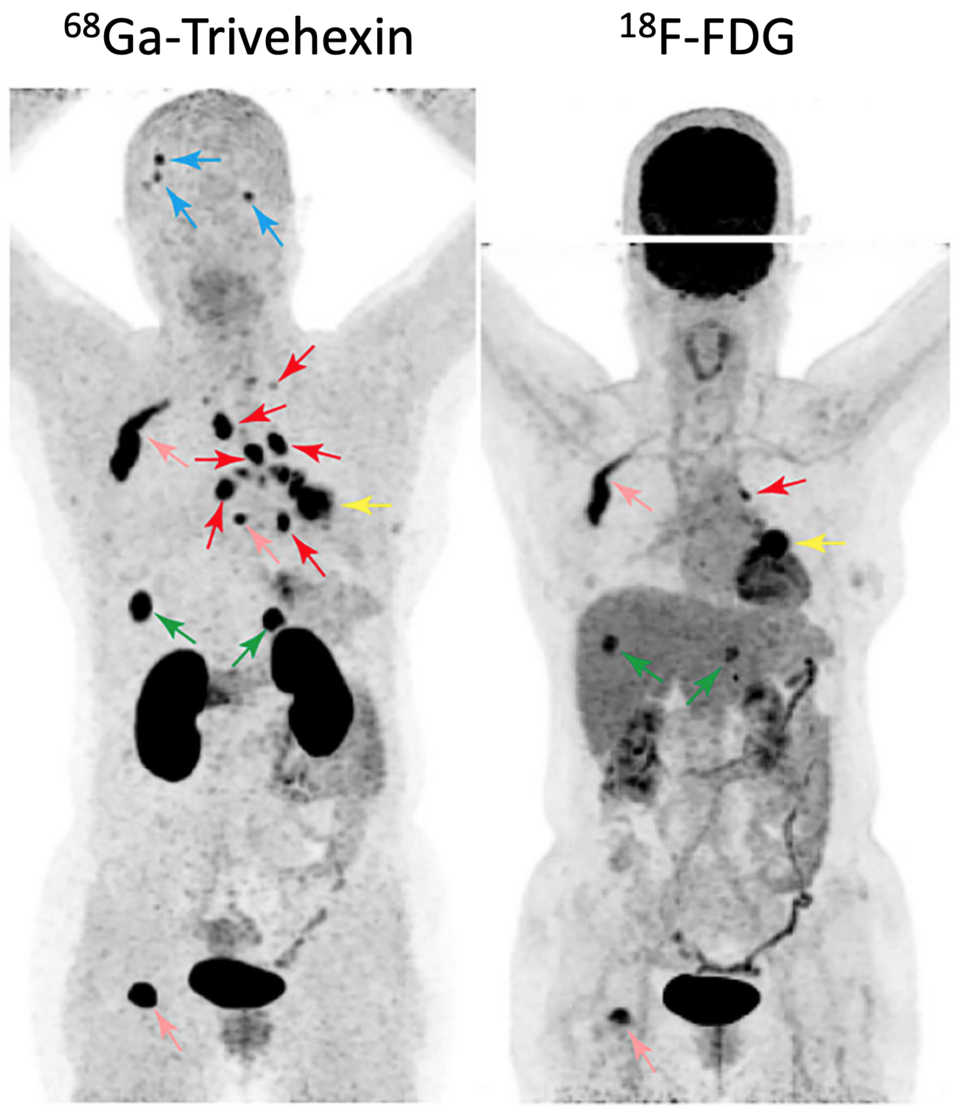
Comparison of Ga-68 Trivehexin and FDG PET imaging in non-small cell lung cancer evaluation
Wikimedia Commons: Ga-68-Trivehexin vs FDG Non Small Cell Lung Cancer Brain Metastases AdvSci 2025 He-et-al.png
Tissue Structures
| Structure | Density (HU) | T1 (ms) | T2 (ms) | Echo | Rel. Size | |
|---|---|---|---|---|---|---|
| Lung Field | -700 | 1200 | 30 | 0.0 | 35% | |
| Heart | 50 | 1030 | 40 | 0.5 | 15% | |
| Aorta | 45 | 1200 | 50 | 0.3 | 4% | |
| Rib | 700 | 300 | 3 | 0.95 | 3% | |
| Vertebra | 400 | 350 | 5 | 0.9 | 6% | |
| Muscle | 40 | 900 | 35 | 0.4 | 10% | |
| Fat | -100 | 250 | 80 | 0.6 | 8% | |
| Skin | 20 | 600 | 40 | 0.3 | 2% |
Compatible Imaging Instruments
| Model | Manufacturer | Modality |
|---|---|---|
| Aquilion ONE PRISM | Canon Medical Systems | CT |
| Vantage Galan 3T | Canon Medical Systems | MRI |
| Aplio i900 | Canon Medical Systems | ULTRASOUND |
| SCENARIA View | Fujifilm Healthcare | CT |
| Arietta 850 DeepInsight | Fujifilm Healthcare | ULTRASOUND |
| Revolution Apex | GE HealthCare | CT |
| SIGNA Hero | GE HealthCare | MRI |
| SIGNA Premier | GE HealthCare | MRI |
| Discovery MI Gen 2 | GE HealthCare | PET |
| Voluson Expert 22 | GE HealthCare | ULTRASOUND |
| Resona I9 | Mindray | ULTRASOUND |
| Spectral CT 7500 | Philips Healthcare | CT |
| Ingenia Ambition 1.5T | Philips Healthcare | MRI |
| EPIQ Elite | Philips Healthcare | ULTRASOUND |
| Vereos Digital PET/CT | Philips Healthcare | PET |
| SOMATOM Force | Siemens Healthineers | CT |
| MAGNETOM Vida | Siemens Healthineers | MRI |
| MAGNETOM Terra.X | Siemens Healthineers | MRI |
Edit Image Metadata
AI Generate Image — Adult Chest
Fill in the imaging criteria below. A prompt will be built and sent to OpenAI to generate a realistic medical image.