Whole Body (PET/CT)
Whole Body (PET/CT)
OncologyWhole-body PET/CT phantom with FDG-avid lesions in lung, liver, and lymph nodes for oncologic staging
Image Library
Filter:
PET — Maximum Intensity Projection
Maximum intensity projection PET scan showing FDG distribution throughout the body
Whole-body FDG-PET MIP view for oncologic staging
https://commons.wikimedia.org/wiki/File:PET%20scan%20image.jpg
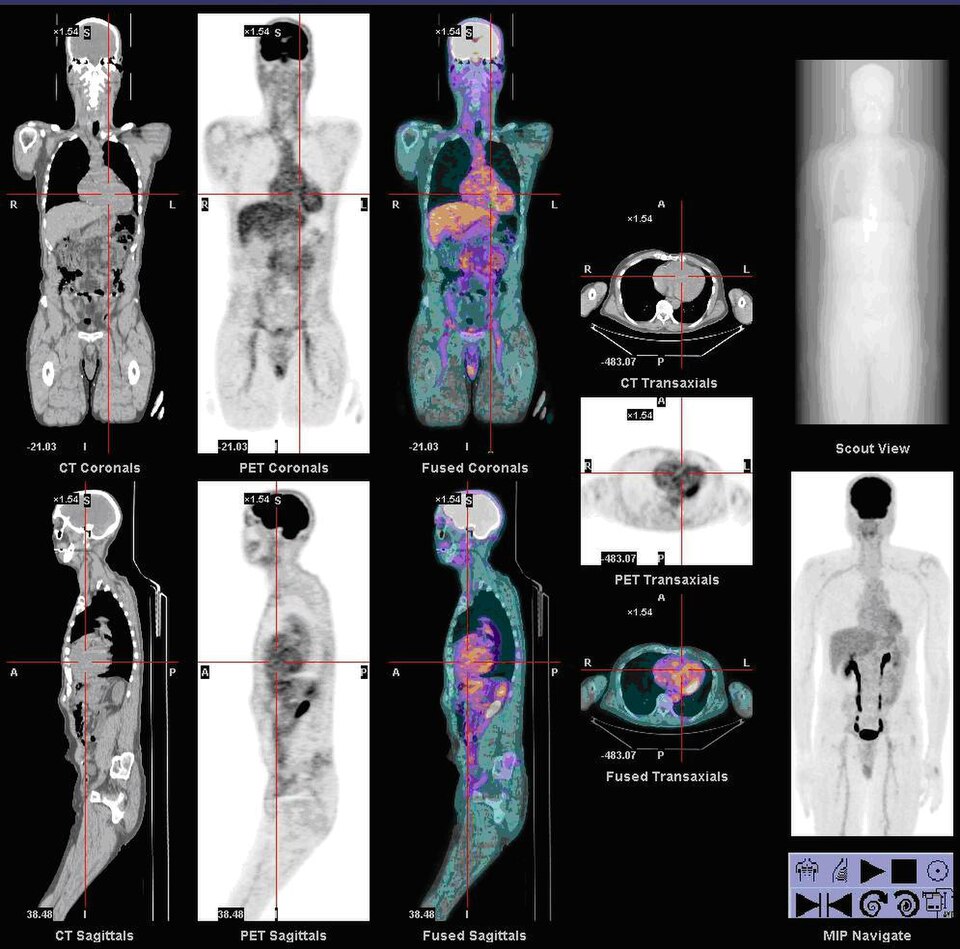
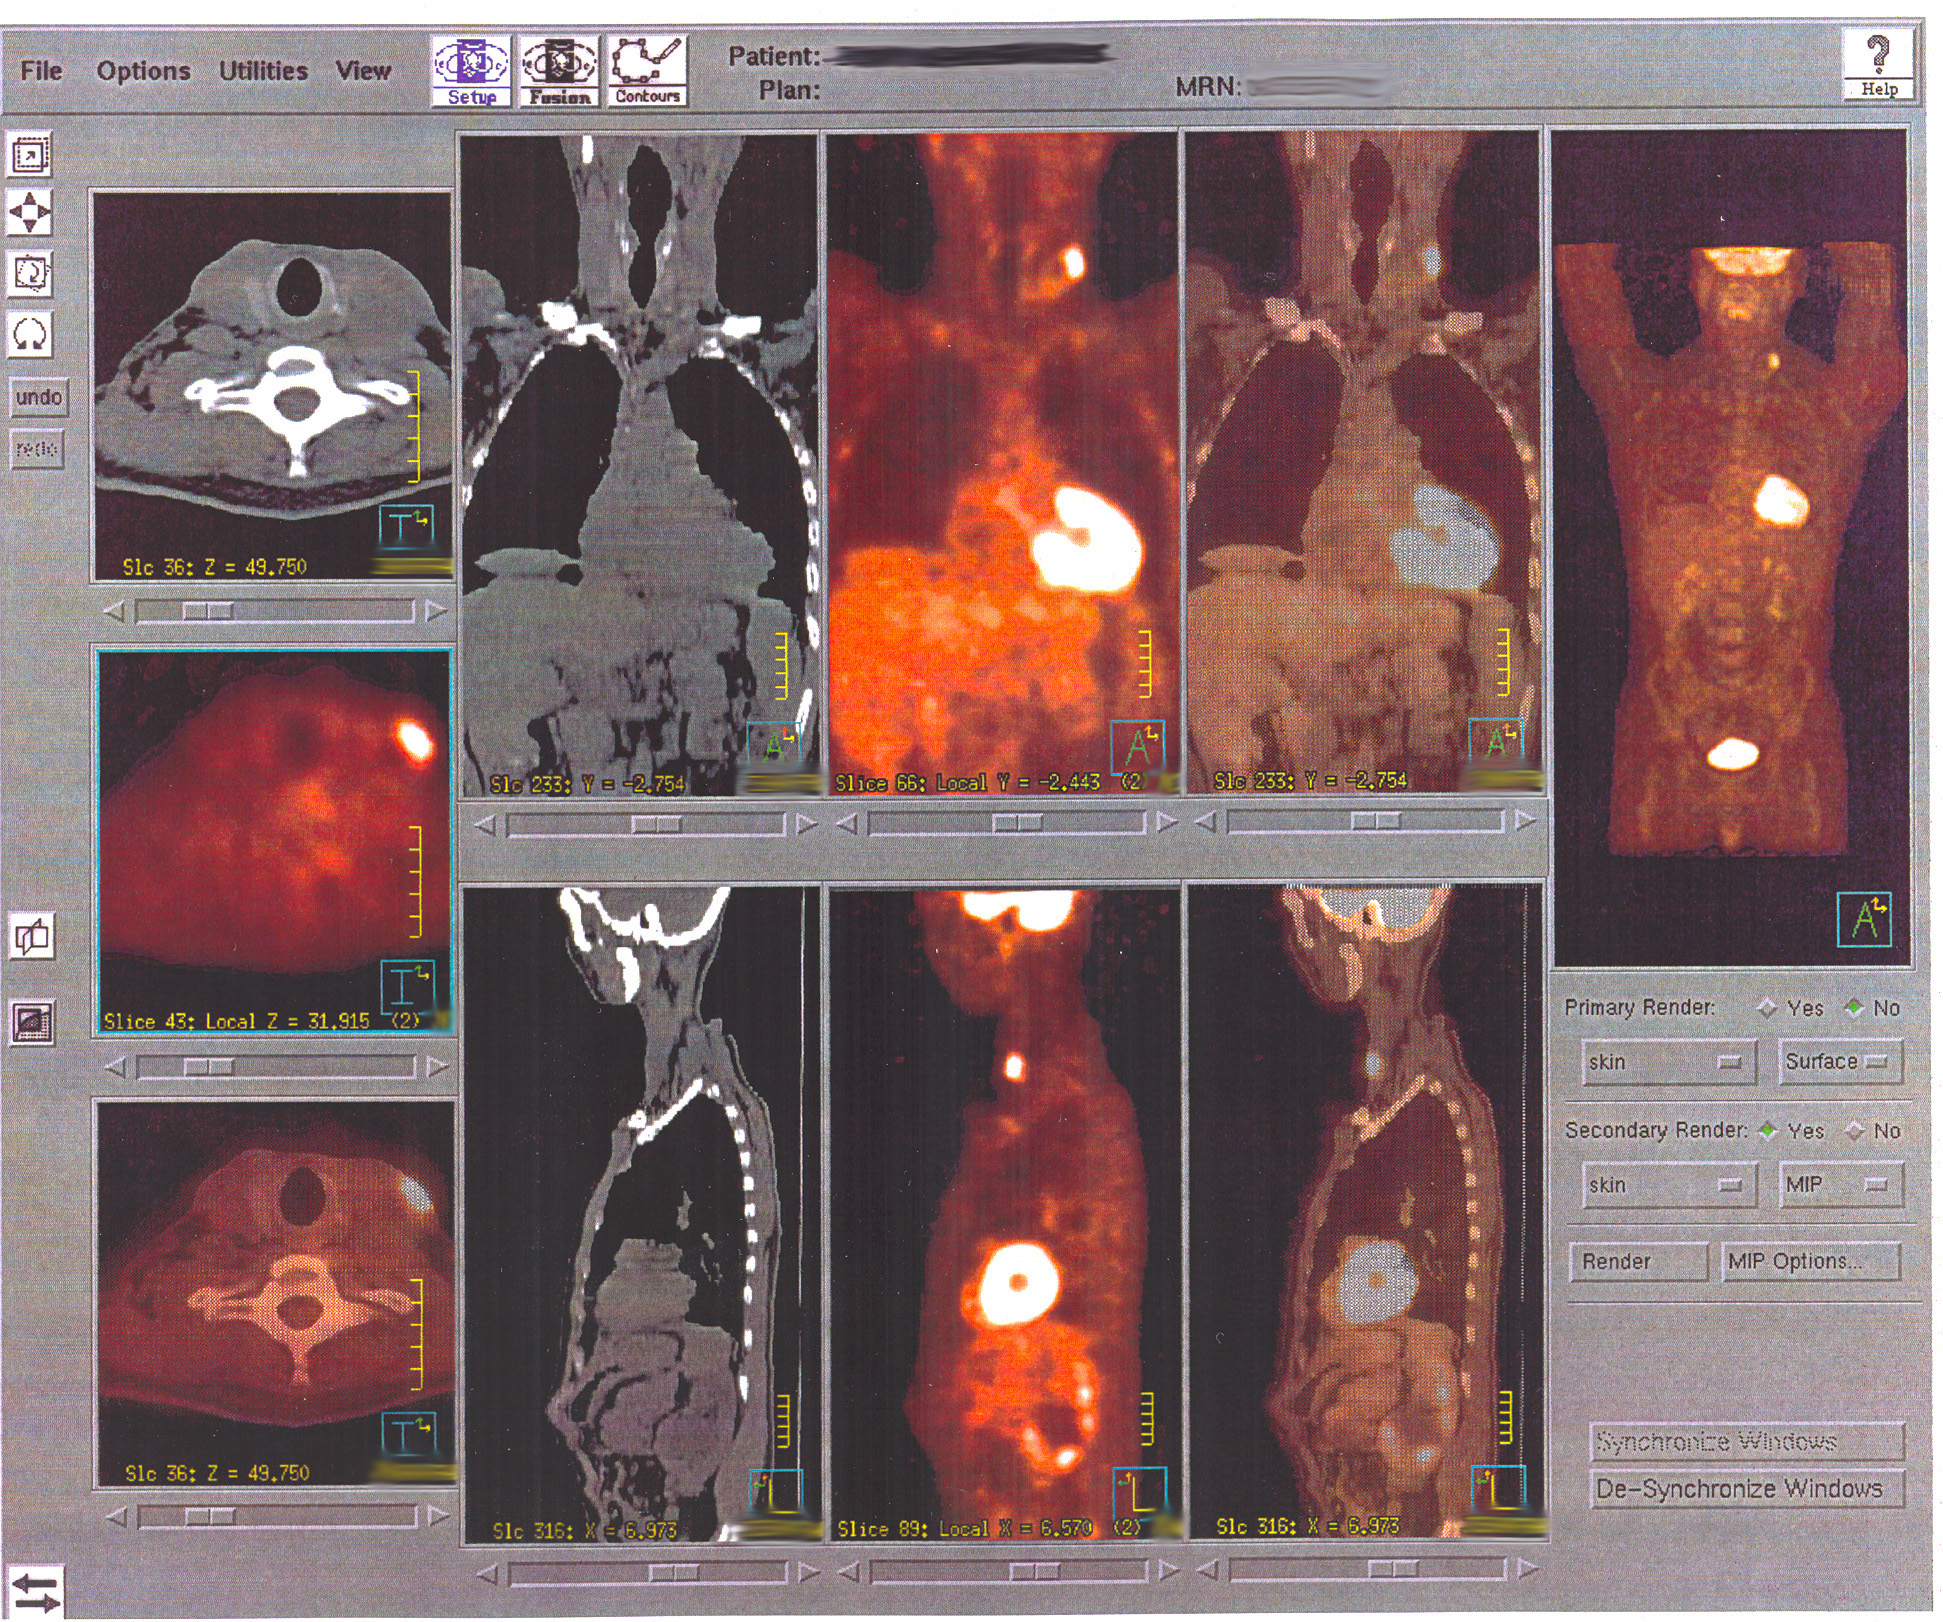
Whole Body PET/CT — FDG
Whole-body FDG PET/CT scan
https://commons.wikimedia.org/wiki/File:Nl%20petct.jpg
PET — MIP View
Maximum intensity projection of whole-body PET
https://commons.wikimedia.org/wiki/File:RenalCancer-250MBq-FDG-PET-CT%20Vergleich.jpg
Tissue Structures
| Structure | Density (HU) | T1 (ms) | T2 (ms) | Echo | Rel. Size | |
|---|---|---|---|---|---|---|
| Lung Field | -700 | 1200 | 30 | 0.0 | 20% | |
| Lung Lesion | 40 | 1400 | 90 | 0.0 | 3% | |
| Liver | 60 | 800 | 40 | 0.5 | 12% | |
| Liver Metastasis | 45 | 1300 | 80 | 0.3 | 2% | |
| Lymph Node | 35 | 1200 | 70 | 0.3 | 3% | |
| Heart | 50 | 1030 | 40 | 0.5 | 8% | |
| Kidney | 35 | 1000 | 60 | 0.4 | 4% | |
| Bladder | 10 | 3000 | 500 | 0.05 | 4% | |
| Vertebra | 400 | 350 | 5 | 0.9 | 5% | |
| Muscle | 40 | 900 | 35 | 0.4 | 12% | |
| Fat | -100 | 250 | 80 | 0.6 | 10% |
Compatible Imaging Instruments
| Model | Manufacturer | Modality |
|---|---|---|
| Aquilion ONE PRISM | Canon Medical Systems | CT |
| SCENARIA View | Fujifilm Healthcare | CT |
| Revolution Apex | GE HealthCare | CT |
| Discovery MI Gen 2 | GE HealthCare | PET |
| Spectral CT 7500 | Philips Healthcare | CT |
| Vereos Digital PET/CT | Philips Healthcare | PET |
| SOMATOM Force | Siemens Healthineers | CT |
| Symbia Intevo Bold | Siemens Healthineers | SPECT |
Edit Image Metadata
AI Generate Image — Whole Body (PET/CT)
Fill in the imaging criteria below. A prompt will be built and sent to OpenAI to generate a realistic medical image.